| Report Generator | Search Help Desk |
The Figure "For" Loop Component
A looping component executes its subcomponents several times. There are two types of looping components: flow control (e.g., For Loop, While Loop) and object (e.g., Handle Graphics Figure "For" Loop, Simulink Model Loop). One type of object looping component is the Handle Graphics Figure "For" Loop. The Handle Graphics Figure "For" Loop executes its subcomponents (or loops over them) several times, each time applying its subcomponents to a different figure. You use the attributes page to specify the figures on which looping is to occur. The tutorial in the next section shows how the Handle Graphics Figure "For" Loop works.Using the Handle Graphics Figure "For" Loop: A Tutorial
This section presents a figure loop tutorial to demonstrate how to use the attributes page for the Handle Graphics Figure "For" Loop. This tutorial shows how editing a component's attributes changes the information that the component inserts in the report. In this figure loop tutorial, you will:.png images. Make sure you have a viewer that can read .png images (for example, Netscape 4.05 or later), and choose the appropriate output format in the Setup File Editor. See "Specifying the Report Output" in Chapter 2 for more information on output formats and viewers.
Starting the Tutorial
To use the figure loop tutorial and edit the setup file, type the following at the command line:setedit figloop-tutorial
Creating Handle Graphics Figures
To create the Handle Graphics figures that you will be using in this tutorial, you should first close all of your figures. To close all figures that may still be open, typeclose all at the command line.
Type figloopfigures to create Figures 1 - 5. Figures 1,3, and 5 appear on the screen, but Figures 2 and 4 do not.
Figures 1, 3 and 5 are shown below.
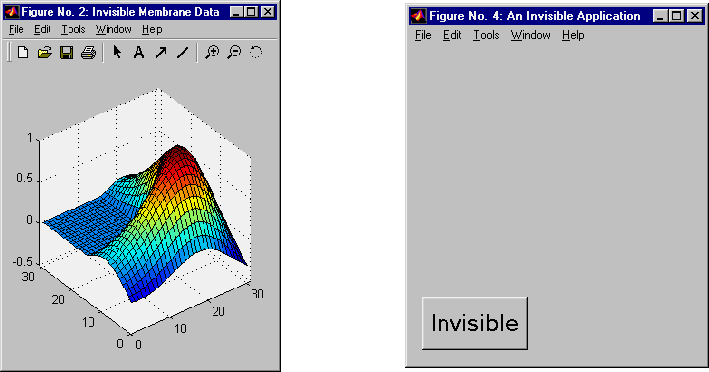
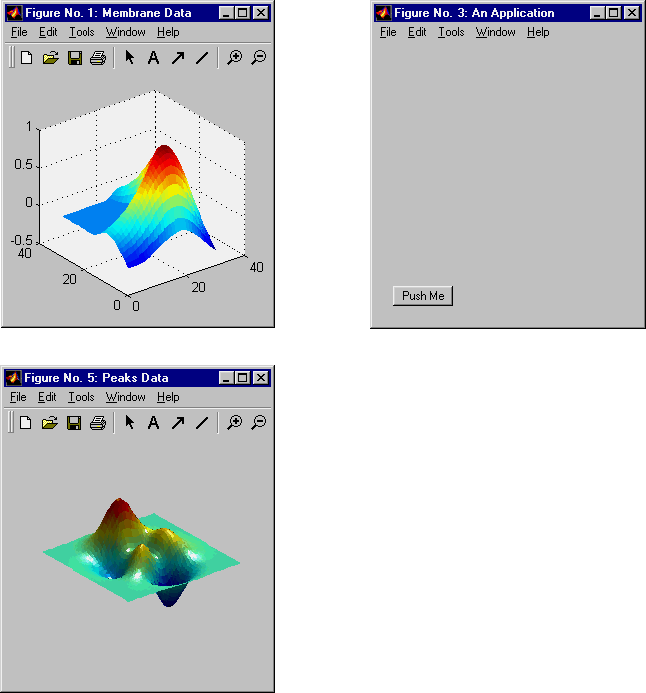 Figure 2 and 4, which do not appear on the screen because they are invisible, are shown below.
 Before you continue with the rest of the tutorial, it is important that you understand some important Handle Graphics concepts, such invisible figures,
 HandleVisibility, and tags. These are described in the next section.
Understanding Important Handle Graphics Concepts
There are three important Handle Graphics concepts you need to be familiar with before proceeding with the rest of this tutorial:HandleVisibility
Invisible Figures
When you typefigloopfigures, Figures 1,3, and 5 appear (see previous page), but Figures 2 and 4 do not. Figures 2 and 4 are invisible (visible='off'), so you can only see three figures. An invisible figure does not appear on screen; it exists, but it is hidden.
HandleVisibility
Figures 3 and 4 haveHandleVisibility='off'. HandleVisibility is a parameter of a Handle Graphics figure, and it determines whether the handles in your figure are visible. See Using MATLAB Graphics for more information on HandleVisibility.
To list all figures in your workspace that have HandleVisibility='on', type get(0,'children')at the command line. The results show that Figures 5, 1, and 2 have HandleVisibility='on'.
ans =
     5
     1
     2
Note that most figures have HandleVisibility='on'. To turn HandleVisibility off, you have to specify HandleVisibility='off' with the following:
set(handle,'HandleVisibility','off')
Tags
A Handle Graphics figure can have a tag. A tag is a Handle Graphics figure parameter. A tag does not appear in a figure; it is an identifier that you specify. If you want to see what, if any tag, a figure has, typeget(<handle>, 'tag'). The handle of a figure is the figure number; enter the figure number for <handle>. For example, to see whether Figure 1 has a tag, type get(1, 'tag'). The following will appear:
ans =
     membrane
This means that Figure 1 has a tag called membrane.
Every figure in this tutorial has a tag. However, by default, figures have empty tags.
Tutorial Figure Summary
The following table shows visibility (figure is visible ifvisible='on' and invisible if visible='off'), HandleVisibility, and tags for the figures in the tutorial.Editing the Figure "For" Loop Component
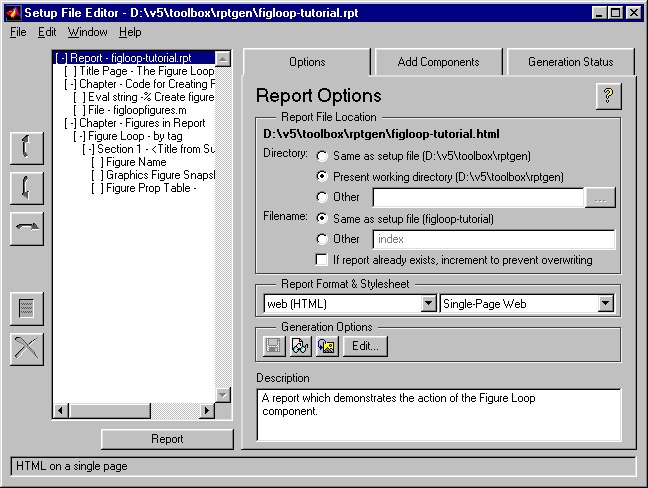
Select the Figure Loop component and click on the Options tab. This will display the attributes page for the Figure "For" loop component.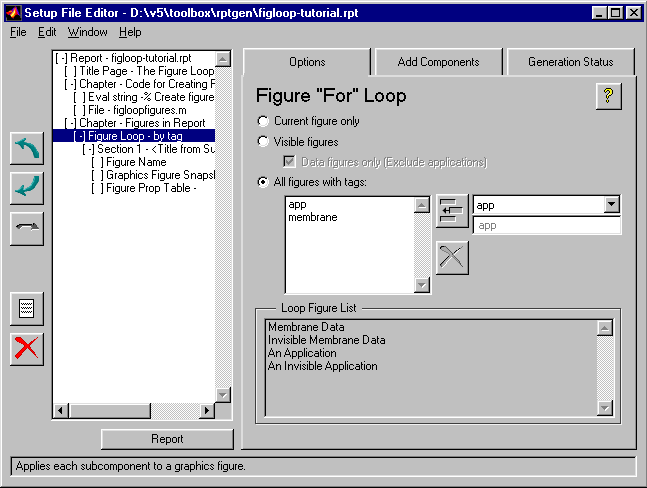
Finding Out What Figures Are Looped On
The Loop Figure List shows you what figures are looped on when the report generates. Note:gcf (get current figure) in the MATLAB window. The following appears:
This means that Figure 2, "Invisible Membrane Data," is the current figure. Note:ans =2
Generating a Report
To generate a report, click on the Report button. The generated report has two chapters. Chapter 1 contains the code for creating the figures. The second chapter contains the images that were looped on: "Membrane Data," "Invisible Membrane Data," "An Application," and "An Invisible Application." These are the four figures shown in the Loop Figure List.Choosing Figures to Loop On
You can choose to loop on:Looping on the Current Figure
Select the Figure 5 window ("Peaks Data") to make Figure 5 current. To include only the current figure in the report, select Current figure only. Notice that the Loop Figure List now shows Peaks Data only. Click on the Report button to generate a report. Note:HandleVisibility = 'on' is the current figure.
Looping on All Visible Figures
To loop on all visible figures, select Visible figures. This option runs subcomponents of the Figure "For" Loop component for all figures that are currently open and visible.With HandleVisibility='on'
The Data figures only option is checked by default and excludes figures withHandleVisibility = 'off' from the loop. The Loop Figure List contains:
HandleVisibility = 'on'("Membrane Data" and "Peaks Data") and HandleVisibility = 'off' ("An Application") are now included in the loop.
The Loop Figure List now contains:
HandleVisibility 'off')
Looping on Figures With Certain Tags
To loop on figures with certain tags, select the All figures with tags option. When you select a tag, all figures with that tag are included, regardless of whether the figure is visible or whetherHandleVisibility is 'on' or 'off'.
See the "Tags" section earlier in this tutorial for a brief discussion of Handle Graphics tags.
Adding a Tag to the Tag List Box
To add a tag to the tag list box, select the tag from the drop box on the right and click on the Add button, shown below. The tutorial tag list box on the left starts with app and membrane. For example, to add
 peaks to the list, click on the down arrow in the tag drop box on the right and select peaks. Then click on the Add button.
Adding a Tag Manually
The tag drop box on the right shows a list of tags for figures that are open. If you want to add a tag that does not appear in the tag drop box, you can manually type in the tag. To type in a tag, select Enter tag in edit field and type in the name of the tag in the edit field below the tag drop box. Then click on the Add button.Removing a Tag From the Tag List Box
To remove a tag from the tag list box, select the tag and click on the delete button. Note that you can select multiple tags in the tag list box. The tag list box should now contain app, membrane, and peaks. To remove membrane and peaks, hold the Ctrl key down and click on membrane and peaks. Both membrane and peaks are now selected. To delete them from the list box, click on the Delete button, shown below. The only tag remaining in the tag list box is app. The Loop Figure List now contains An Application and An Invisible Application. Click on the Report button. Notice that the report only contains "An Application" and "An Invisible Application."
Tutorial Summary
This completes the figure loop tutorial. This tutorial showed you how to edit the Handle Graphics Figure "For" Loop attribute page to loop on different figures and include them in your report. This tutorial showed you how to loop on: