Plot transfer function (may be with confidence bounds), and/or ratio of output and input Fourier amplitudes.
Syntax
ploteltf(pdat1)
ploteltf(Fdat)
[ha1,ha2,fsc] = ploteltf(pdat1,pdat2,Fdat,fscale,msc,...
                      cdat1,cc,cn,rec,expi,ntx)
Description
ploteltf plots transfer functions. pdat1 and pdat2 may be parameter vectors (see exppar), or parameter filenames. The first transfer function is plotted by mark '-', the second one by '.', at 256 equally distributed frequency points (equal distribution is understood here in either linear or logarithmic scaling). Also the ratio of output and input Fourier amplitudes can be plotted with mark '+': these can be given in the Fourier vector Fdat, or in a file given by this string.
fscale defines the scaling of the frequency axis. Possible values:
'lin': linear, from 0 to either the half of the sampling frequency in any of the parameter sets, or the maximal frequency in Fourier frequency vector (whichever is larger). If no Fourier data were given, and s-domain parameter set(s) are investigated, the maximum frequency will be the double of the suggested scaling frequency, calculated by exppar for the given transfer function.
'linF': linear, from 0 to maximal frequency in the Fourier data.
'lin',f1,f2]: linear from f1 to f2.
'log': logarithmic, between 1e-3*fs/2 to fs/2 (fs is the higher sampling frequency in the parameter sets, if there is any), or from 1e-3*maxf to maxf (maximal frequency in the Fourier data). For s-domain parameter sets with no Fourier file, plot from 1e-2*fscale to 10*fscale.
'logF': logarithmic, from minimal nonzero frequency to maximal frequency in the Fourier data.
'log',f1,f2]: logarithmic from f1 to f2.
The scaling of the amplitude plot can be influenced by msc. Its possible values are as follows: 'full' to scale to all points, 'passb' to scale to passband only (defined by the minimum and maximum of frequencies, for which y is not zero in Fdat). If a '-' is appended to this parameter, only the phase is plotted, if a '+', only the amplitude.
For confidence interval plots of pdat1, the covariance matrix of the estimated parameters of pdat1 can be given by cdat1 as an array, or as a covariance vector (see expcov), or as the name of the covariance file. The ±2 bounds are plotted, usually at 32 points of the estimated magnitude and phase values, or at each frequency in Fdat. The number of points can be changed by
 cn between 1 and 256. The bounds can be changed by a multiplying factor cc. Its default value is 2.
The value of cc and the approximate confidence limit (Pc) are displayed under the plot, assuming normal distribution.
It is also possible to add confidence bounds to the nonparametric transfer function estimate points, defined by Fdat. For this purpose, the variance data have to be given in the place of cdat1, as a variance array [vx,vy] or [vx,vy,cxy], or as a variance vector (see expvar), or as a variance filename. ploteltf will recognize the type of the covariance/variance data; in an ambiguous case (long vector form) a covariance matrix of pdat1 will be assumed as given.
One is interested sometimes in the reciprocal of the transfer function, or in the reciprocal of the measured transfer function in the Fourier data (equalization). You can plot the reciprocal of any of the functions. rec = 'abc', where the letters refer to pdat1, pdat2, Fdat, respectively: 's' means straight (no reciprocal building is necessary), 'r' means reciprocal before plotting.
expi is the number of the experiment(s) in Fdat to be plotted. If expi is empty, all the experiments in Fdat will be plotted.
ploteltf puts some textual information to the plots. If ntx is given with the value 'notext', the filenames will not be shown in the plot.
For the purpose of further plots on the screen, the handles of the magnitude and phase plots (the axis vectors in MATLAB 3.5) are exported to ha1 and ha2. To avoid unwanted exponents below the frequency axis, the frequency vector is often scaled internally (to kHz, MHz or mHz). The scaling frequency is exported in fsc.
The magnitude plots are scaled in dB. To avoid annoying downscaling, the zeros of the transfer function are substituted by -100 dB values.
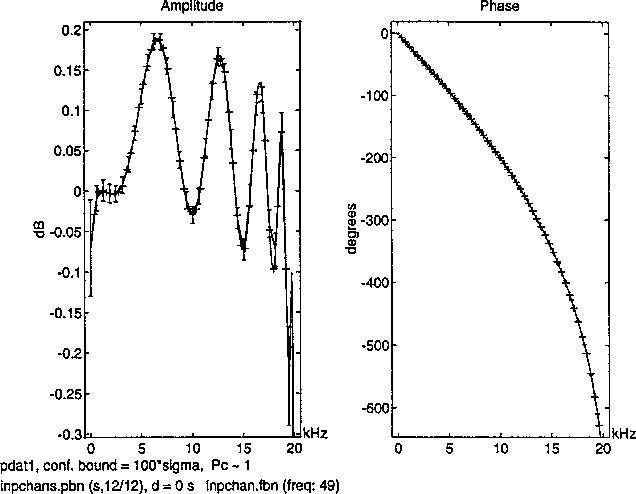
A typical plot is shown in the figure.
Default Argument Values
Fdat = '', fscale = 'lin', msc = 'full', cdat1 = '', cc = 2, cn = 32, rec = 'sss', expi = [], ntx = ''.
If only Fdat is given, this must be a Fourier filename, otherwise the program cannot distinguish it from a parameter vector.
Examples
ploteltf('inpchans.pbn','','inpchan.fbn','linF','full+');
num = [1.1,1]; denom = [4,3,2,1];
[ha1,ha2,fsc] = ploteltf(exppar('z',num,denom,0));
Algorithm
The confidence bounds are calculated using stdtf or stdtfm.
See Also
stdtf, stdtfm
[ Previous | Help Desk | Next ]