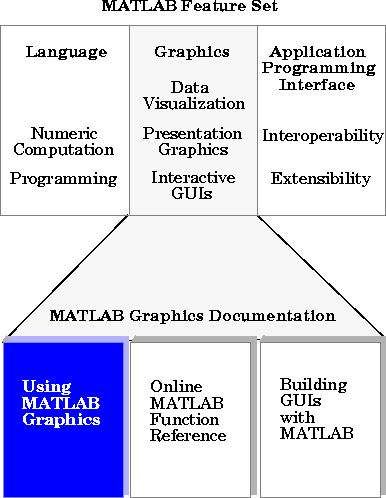
| Using MATLAB Graphics | Search Help Desk |
|
This manual in PDF:
Using MATLAB Graphics
|
| Task |
Relevant Topic Areas |
| Displaying vector data as line plots, bar graphs, histograms, and other specialized graphs. |
Basic Plotting Specialized Graphs |
| Displaying surface plots of matrix data, visual representation of mathematical functions. |
Creating 3-D Graphs Defining the View Lighting as a Visualization Tool |
| Displaying volume data |
Volume Visualization Techniques Defining the View Lighting as a Visualization Tool |
| Displaying 3-D modeling data, creating objects with polygons. |
Patch Objects for 3-D Modeling Defining the View Lighting as a Visualization Tool |
| Displaying bit-mapped images |
Displaying Bit-Mapped Images |
| Labeling axes, adding text annotations, printing and exporting to files |
Labeling Graphs Plot Editor Printing MATLAB Graphics |
| Programming graphics M-files |
Handle Graphics Figure Properties Axes Properties |