Examine in succession, four ratio images about which we will briefly comment.
 (3/1)
(3/1)  (4/2)
(4/2)
The ratio of band 3 to band 1 (3/1)renders most of the area in rather dark grays but several areas are whitish (brighter). These probably correspond to zones of strong hematitic alteration (very reflective in band 3 but dark in band 1). The ratio 4/2 is similar but the bright areas appear displaced; these may mark local areas of denser vegetation.
 (7/5)
(7/5)  (1/7)
(1/7)
The 7/5 image has a unique pattern in which a hook-shaped dark area within a scene otherwise light-toned coincides closely to the general altered zone; band 7 is an excellent detector of hydrous minerals such as the clays, alunite, etc because these absorb radiation (hence significantly reduce reflectance). Ratio 1/7 shows bright areas that are approximately the same as the basalts and some of the andesites.
A ratio color composite made up of B = 7/5, G = 1/7, and R = 3/1 does not separate the two volcanic rock types (both are blue-green) but shows White Mountain as purple and renders some of the k/a areas yellow.
 (1)
(1)  (2)
(2)
A second ratio composite, with B = 1/7, G = 4/2, and R = 3/1, produces a much different result. The deep blue closely expresses the basalt outcrops with the andesites now in a different shade of blue. White Mountain is a distinct orange-brown (but note that the same color appears north of the basalt). The k/a zones are a purplish red as distinct from a different red for the more iron-rich zones. Judge for yourself whether ratio images improve on standard composites in terms of alteration detection.
Lets evaluate the utility of Principal Components Analysis (PCA). The first principal
 (1)
(1)  (2)
(2)
component provides, as we've seen before, a view much like a b & w aerial photo. Lighter tones mark k/a alteration areas. There are several very bright, small spots. These are probably pits dug by prospectors (one exposing exceptional quality alunite was visited in the field by the writer but was not entered when about 30 rattlesnakes were spotted crawling about - there are limits to one's ambitions as a remote senser!). The second principal component is darker overall, with some alteration especially dark. It again shows the bright spots and a bright area west of the basalt hills is part of the area noted in the regional scene as light-toned alluvium. The third principal
 (3)
(3)  (4)
(4)
component seems meaningless, except that the black spots probably correspond to certain alteration zones. A glance at the fourth principal component shows the same dark hook-like pattern observed in ratio 7/5. White Mountain is set apart by its light tones, with similar tones north of the basalt.
A principal component color composite consisting of blue = PC2, green = PC4, and red = PC1 is resplendent with information. The basalt rocks appear blue-green whereas the andesites tend to be occupied by dark blues. White Mountain is a distinct yellow as is the area above the basalts (this strongly implies that these are outcrops of limestone like that at White Mountain; no geologic map to prove that supposition is available). The k/a zones appear in wine purple color; the hematitic zones are deep reds and yellows. The areas covered by alluvium tend to be multi-colored, with uncertain boundaries.
 (241)
(241) A second PCA composite where Blue = PC4, Green = PC5,
Red = PC2 is less definitive. Basalts are purple and andesites may be green
and/or yellow. White Mountain is not distinct. The k/a zones are
bright red but part of these is bounded by a black pattern whose
nature is puzzling; nothing like it is evident in the individual
PCA images but the nebulous PCA5 may be making a contribution.
 (452)
(452)
Earlier, a PCA composite (shown below) was made from the 24-channel Bendix aircraft flight over White Mountain. For this, 8 non-thermal channels were included and components 1, 2, and 4 were combined into the composite shown below. Again, most of the units mapped in the field and discerned in the Landsat images seem to show up but in some instances occupy somewhat different areas and have dissimilar sizes of outcrop. But, it is safely concluded that, using the Bendix image as standard, the TM PCA composites match fairly well - good enough to stand alone as successful guides to the principal rock and alteration types actually defined by field work.
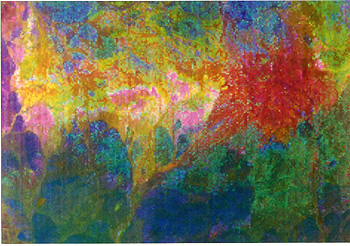
We come now to a highlight of Scene 5 - a supervised classification made by Idrisi with training sites based both on the maps and on field observations by the author. Ten classes were established and then singled out in training sites used to run a Maximum Likelihood classifier. The end result is displayed here.
This is both a colorful and a believable product. The classes designated Basalt (dark blue) and Andesite (green) are largely where they should be in field terms. White Mountain is well separated but its legend color (whitish) also is found where additional limestone outcrops are postulated north of the basalts. The kaolinite/alunite zone (purple) coincides well with the map information. The class designated as Ironrich (brown) is broadly equivalent to the geologic map unit called "moderately hematized" whereas the class called Hematite (red) matches at least some of the map units called "strongly hematized" . Arbitrarily, four different classes of alluvium were set apart based on photointerpretation and geologic reasoning. The class MixAlluv (gray) is partly within the altered zone and is assumed to be a mix of altered rock and volcanic rock debris. DrkAlluv (dark gray) is a differentiable deposit consisting mostly of weathered volcanic residue. The class LsAlluv (light blue) is presumed to contain considerable contributions from White Mountain and other limestone sources. BrtAlluv (yellow) refers to alluvium west of the western basalt hills which probably received much of its input from the Wah Wah Mountains; its brightness (in individual bands and color composites) implies a variety of light-colored detritus (fragmented debris) and clays.
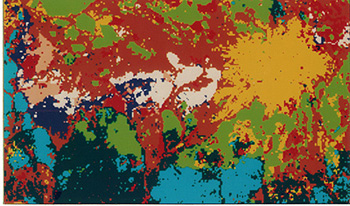
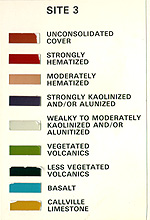
A different Landsat TM image (Fall 1985) was also classified to test the effects of different dates and times of year; the same map was used to pick training sites but these were not necessarily the same as selected for the above supervised classification and the processing algorithm for maximum likelihood classification was that employed by the IDIMS program. Here above is the resulting classification and a color code for the selected classes (note that these are not the same as for the first classification). The major differences between the two classifications are 1) the volcanic units are subdivided in part by degree of vegetative cover, and 2) the unconsolidated cover (alluvium) is treated as a single unit. In general, the correspondence between the two classification images and between this Fall classification and the published map is good in both instances.
This case study with its accompanying images should serve to convince you that satellite remote sensing has practical value - already insinuated in the Overview and the content of the first four Sections - that can lead to possibly sensational payoffs. Granted that the White Mountain example is almost a sure thing. The several major types of alteration are distinctly different, so much so that the color aerial photo is almost sufficient to produce an accurate map (remember, we said that the imagery seem superior to the pre-Landsat field map). But, the several special processing products all make these differences even more obvious to the eye.
Imagine that you are given a one-time opportunity to stake several claims anywhere in the State of Utah but must do so in 30 days. Its a big state! But with Landsat and other space imagery, properly processed, you can narrow down this huge area just to those small patches that apparently display abundant gossan. The most promising of these can be visited in brief trips, with rapid reconnaissance seeking signs of minerals. Samples can be taken for quick assay to determine grade or concentration (amounts of useful metals present per unit volume). Favorable results mean that you ought to file a claim by the deadline. Then, you must drill and map in detail to determine whether any mineralization you have detected is in enough gross volume to warrant development and mining. With any luck, you will be rich even as you learn to fully realize the merits of prospecting from space.
Your chances of finding promising signs of mineralization will improve sharply if you can use a spectrometer rather than multiband imagery. This is because many subtle variations in composition, as well as key information that helps to identify individual mineral species, are present in detailed spectral curves but may be lost in undersampled multiband spectral data. Spectrometers can now be flown on air and space platforms, providing hyperspectral rather than multispectral imagery and plots. AVIRIS, mentioned first in the Introduction Section, is one such system. Its use at the Cuprite, Nevada mineralized site is described in Section 13.
Code 935, Goddard Space Flight Center, NASA
Written by: Nicholas M. Short, Sr. email: nmshort@epix.net
and
Jon Robinson email: Jon.W.Robinson.1@gsfc.nasa.gov
Webmaster: Bill Dickinson Jr. email: rstwebmaster@gsti.com
Web Production: Christiane Robinson, Terri Ho and Nannette Fekete
Updated: 1999.03.15.