Averaging and variance analysis of multiple experiments.
Syntax
[vx,vy,cxy] = varanal(Fdat,expi)
[vx,vy,cxy,mx,my,Na,Np,cfl,dv,sd] = ...
      varanal(Fdat,expi,synch,T,inp,outp)
Description
varanal averages frequency domain amplitudes as results of experiments, and calculates the empirical variances and input-output covariances of complex amplitudes. The results of the individual experiments are given either in just one Fourier vector Fdat (see expfou); or an array [freqvlong,x,y], where freqvlong contains the frequency vector, repeated as many times as the number of experiments (the first frequency may not be repeatedly present in the short frequency vector); or in a file with name given in Fdat. A further possibility is when the string Fdat is the name of a user-defined function M-file, which can be called using eval. If the serial number of a given experiment is i, and Fdat is 'getfou', then [freqv,x,y] = getfou(i) must return the data of the ith experiment.
expi is the vector of the serial numbers of the experiments to be processed.
Averaging can be easily performed if the measurements were made in a synchronized way. However, when this is not the case, the routine can also be asked to try to "synchronize" the input vectors (assuming that they resulted from FFTs of the same length), minimizing the weighted phase differences of the complex amplitudes in the frequency domain by introducing a delay. Such synchronization can be requested by giving the argument synch with the value 'synch'. For this synchronization attempt, the maximum value of the delay (the period length for periodic signals) is advisable to be given in T, although varanal makes an attempt to find a reasonable period length if T is not given. Since T specifies the range of rough search, a value of T slightly larger than the period length is preferred to a smaller one.
For synchronization, the elements of the frequency vector have to be given in Fdat with sufficient accuracy. The best solution is to generate them in MATLAB from the harmonic numbers. Inaccurate frequency values can be prohibitive for appropriate phase fitting.
If there are several input and/or output ports in the measurement, the user may choose from among them by defining the scalars (or vectors) inp and outp. If any of them is not given, or it is given as an empty vector, each port present in the Fourier data will be used.
The variances are returned in the vectors (arrays) vx and vy, the input/output covariances in
in cxy. In the case of MIMO data, cxy will be an array, containing the covariances beside each other, as [cx1y1,cx1y2,...cx2y1...].
The averaged input and output amplitudes are returned in mx and my.
The variances and covariances of the averaged complex amplitudes mx and my can be obtained as vx/Na, vy/Na, cxy/Na, respectively.
If the nonparametric estimate Ym./Xm is calculated, its approximate standard deviation can be determined from vx, vy, and cxy, using stdtfm. The standard deviations are to be scaled by 1/sqrt(Na) when my/mx is used.
The number of averaged experiments is returned in Na, while the total number of processed experiments is Np. The two numbers may differ because when a synchronization attempt fails, the given experiment is not averaged to the others.
The multiplicative factors to obtain the lower and higher bounds of the 95% confidence intervals of the variances in the Gaussian case are returned in the 1x2 vector cfl. The confidence limits of the real and imaginary parts of the covariance values can be obtained by calculating (cfl-1)*sqrt(varx(k)*vary(k)).
If synchronization is requested, the vector of all the determined delay values is returned in dv. For the values of the delay the inequalities -T/2<delay<=T/2 hold. If the synchronization failed, the corresponding element of dv is NaN.
The delays obtained by varanal can be used for restoring synchronization: if the value dv(i-1) is obtained for the complex amplitude set Xi, exp(j*2*pi*freqv*dv(i-1)).*Xi will give the amplitudes which correspond in phase to the reference set.
sd is the Cramér-Rao bound of the delay values. It is calculated from vx and mx (see [1]):
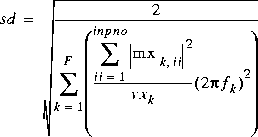 Using the value of
 sd, a 95% significance level test is performed in order to determine if the estimated delays can all be zero (synchronized experiments). If there is no significant deviation from the hypothesis that the experiments are synchronized, a warning message is sent:
The estimated delays are small. With this SNR,
the statistical test shows no significant desynchronization.
If the signal-to-noise ratio is small, the synchronization attempt may fail. This is detected by observing for the best fit a phase deviation higher than  /2 at least at one frequency. When this happens, the experiment will not be averaged to the others.
Default Argument Values
synch = '', inp = [], outp = []
Examples
[vx,vy,cxy,mx,my] = varanal('bandpass.fbn',[1:6],'synch');
[vx,vy,cxy] = varanal('lowpass1.fbn',[1:5],'synch');
Diagnostics
Synchronization can only be done if the Fourier amplitudes turn around by integer multiples of 2 with a time shift of T. If this condition is not met, a warning message is sent:
WARNING! Not all frequency vector elements are integer multiples of 1/T
Maximum relative deviation is larger than 1e-6 in varanal.
varanal makes an attempt to find the period length of the signals from the frequency vector, and compares this to the given value T. if there is a deviation, one of the following warning messages is sent:
WARNING! T does not cover full period length found by varanal: T = ..., Tp = ...
The proper delay may not be found.
or
WARNING! T is larger than period length found by varanal:
T = ..., Tp = ...
Search time may be unnecessarily long.
The synchronization procedure assumes that the signal-to-noise ratio is not very small, that is, in synchronized state the phase differences of the complex amplitudes in the different experiments, at the frequencies given in freqv, are smaller than /2. Otherwise the experiment is skipped (and the delay value NaN appears in dv), and a warning message is sent:
Synchrnization is not successful for experiment ...
Algorithm
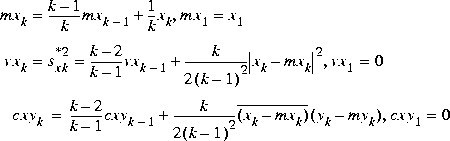
Averaging of every quantity is done in a recursive way.
 The confidence limit factors are calculated from the approximation of the
  2 distribution:
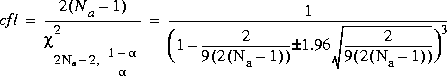 The degrees of freedom equal
 2*(Na-1), because both the real and imaginary parts are used in the estimation.
The synchronization attempt starts with a scan through the possible values of the delay in steps of Tpmin/6, where Tpmin is the smaller value of T and the period length of the largest frequency in the vector freqv. Using the best delay value, an additional, appropriately weighted LS fit of the phases is performed (see [1]). The resulting delay estimate is a maximum likelihood one, if the noises are Gaussian.
See Also
tim2fou
References
[1]I. Kollár, "Signal Enhancement Using Non-synchronized Measurements," IEEE Trans. on Instrumentation and Measurement, Vol. 41, No. 1, pp. 156-159, Feb. 1992.
[ Previous | Help Desk | Next ]