plot(f, mag)
grid on
ylabel('Magnitude (dB)')
xlabel('Frequency (Hz)')
title(sprintf('daqdoc3\\_1\nFrequency Components of Tuning
Fork'))
| Data Acquisition Toolbox | Search Help Desk |
Acquiring Data with a Sound Card
Suppose you must verify that the fundamental (lowest) frequency of a tuning fork is 440 Hz. To perform this task, you will use a microphone and a sound card to collect sound level data. You will then perform an FFT on the acquired data to find the frequency components of the tuning fork. The setup for this task is shown below.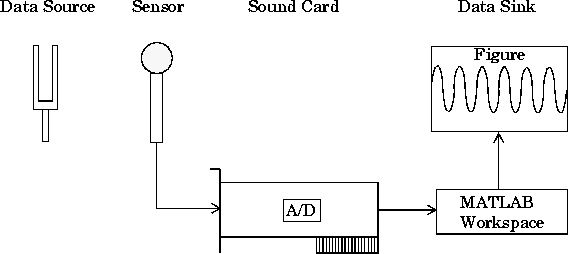
Configuring the Data Acquisition Session
As described in "The Data Acquisition Session", using the Data Acquisition Toolbox to acquire data involves these steps:
 Initialization: Create the analog input object
 AI for a sound card. The installed adaptors and hardware ID's are found with daqhwinfo.
AI = analoginput('winsound'); %AI = analoginput('nidaq',1);
AI, assign values to the basic setup properties, and create the variables blocksize and Fs, which are used for subsequent analysis. The actual sampling rate is retrieved since it may be set to a value that differs from the specified value.
Execution: Startchans = addchannel(AI, 1);%chans = addchannel(AI, 0);duration = 1; %1 second acquisitionset(AI, 'SampleRate', 8000);ActualRate = get(AI, 'SampleRate');set(AI, 'SamplesPerTrigger', duration*ActualRate);set(AI, 'TriggerType', 'Manual');blocksize = get(AI,'SamplesPerTrigger'); Fs = ActualRate;
AI, issue a manual trigger, and extract all data from the engine. Before start is issued, you should begin inputting data from the tuning fork into the sound card (whistling will work as well).
Termination: Deletestart(AI);trigger(AI)data = getdata(AI);
AI.
delete(AI)
start command as shown above, the toolbox returns this error.
??? Error using ==> daqdevice/start
Device 'Winsound' already in use.
You must close the Sound Recorder application and reissue
start.
MATLAB Analysis
For this experiment, analysis consists of finding the frequency components of the tuning fork and plotting the results. To do so, the functiondaqdocfft was created. This function calculates the FFT of data, and requires the values of SampleRate and SamplesPerTrigger as well as data as inputs.
[f, mag] = daqdocfft(data, Fs, blocksize);
daqdocfft outputs the frequency and magnitude of data, which can then be plotted. daqdocfft is shown below.
function [f, mag] = daqdocfft(data,Fs,blocksize)
%DAQDOCFFT calculates the FFT of X using sampling frequency FS
%and the SamplesPerTrigger provided in BLOCKSIZE.
xFFT = fft(data);
xfft = abs(xFFT);
ind = find(xfft==0); % Avoid taking the log of 0;
xfft(ind) = 1e-17;
mag = 20*log10(xfft);
mag = mag(1:blocksize/2);
f = (0:length(mag)-1)*Fs/blocksize;
f = f(:);
The results are plotted below.
This plot shows the fundamental frequency around 440 Hz and the first overtone around 880 Hz. A simple way to find actual fundamental frequency isplot(f, mag)grid on ylabel('Magnitude (dB)') xlabel('Frequency (Hz)') title(sprintf('daqdoc3\\_1\nFrequency Components of Tuning Fork'))
ymax = max(mag);
find(mag==ymax)
The answer is 441 Hz.