Connecting Equal Values with Isosurfaces
Isosurfaces are constructed by creating a surface within the volume that has the same value at each vertex. Isosurface plots are similar to a contour plots in that they both indicate where values are equal.
Isosurfaces are useful to determine where in a volume a certain threshold value is reached or to observe the spacial distribution of data by selecting various isovalues at which to generating a plot. The isovalue must lie within the range of the volume data.
Create isosurfaces with the isosurface and patch commands.
Example - Isosurfaces in Fluid Flow Data
This example creates isosurfaces in a volume generated by the flow M-file. Generate the volume data with the command,
[x,y,z,v] = flow;
To select the isovalue, determine the range of values in the volume data.
min(v(:))
ans =
    -11.5417
max(v(:))
ans =
    2.4832
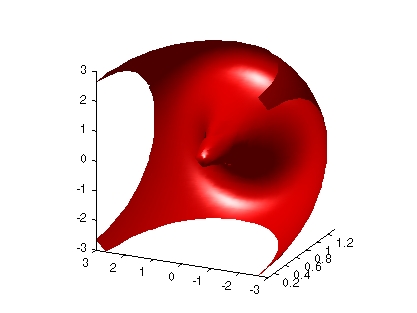
Through exploration, you can select isovalues that reveal useful information about the data. Once selected, use the isovalue to create the isosurface:
hpatch = patch(isosurface(x,y,z,v,0));
isonormals(x,y,z,v,hpatch)
set(hpatch,'FaceColor','red','EdgeColor','none')
daspect([1,4,4])
view([-65,20])
axis tight
camlight left; lighting phong
[ Previous | Help Desk | Next ]