| Using MATLAB Graphics | Search Help Desk |
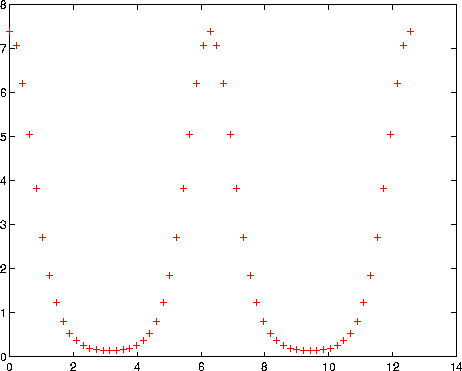
x = 0:pi/15:4*pi;
y = exp(2*cos(x));
calling
plot with only a color and marker specifier
plot(x,y,'r+')
LineSpec for a list of available line styles, markers, and colors.