Later, you will see several examples of single band, low resolution thermal imagery obtained by meteorological satellite sensors. But, for now we turn to a powerful thermal sensor, an airborne instrument known as TIMS for Thermal IR Multispectral Scanner, operated for NASA by JPL. Ground equivalent resolution is 18 m (67 ft). As its name indicates, TIMS breaks the 8-12 µm into 6 bands: (1) 8.2-8.6; (2) 8.6-9.0; (3) 9.0- 9.4; (4) 9.4-10.2; (5) 10.2-11.2; and (6) 11.2-12.2 µm wide, from which 3-band color composites can be produced by various combinations of bands. Although broad, these gather varying amounts of spectral thermal energy that can be related to more discrete (narrower) absorption features associated with minerals that occur in rocks and soils.
From Kahle (1984), Figure 4 in F.F. Sabins, Jr., Remote Sensing: Principles and Interpretation. 2nd Ed., © 1987. Reproduced by permission of W.H. Freeman & Co., New York City.
TIMS has been flown over many test sites of which one of the most informative extends across part of Death Valley (D.V.) in southeastern California. Here the Great Basin meets the Mojave Desert to the south. The Earth's crust is broken along tensional faults allowing segments to downdrop into basins bounded on either side by mountain ranges. As these ranges wear down, debris is carried into the basins partially filling them. Death Valley occupies such a structural basin, within which is the lowest point in the Western Hemisphere (86 m or 282 ft below sealevel). Once largely covered by lakes, the valley is now one of the driest and warmest spots on Earth, with summer temperatures often exceeding 120 °F.
Part of a LANDSAT TM false color composite of the northern end of Death Valley is shown here.
The high mountain block on the left is the Panamint Range, made up of complexly folded and faulted Paleozoic sedimentary rocks; a small segment of the Funeral Range appears at the upper right. The valley contains playas (deposits from ephemeral [usually dry] lakes) and salt pans. Saline deposits, formed from evaporation of intermittent stream waters, include sodium borates (source of the borax hauled out by the famed 20 mule teams) and sulphates, gypsum, and rock salt, mixed with mudstones, carbonates, and floodplain sediments. Water today is at a premium but note the red patch (a golf course!) at Furnace Creek, headquarters for the Death Valley National Monument, located at the edge of a large alluvial fan with active, vegetated distributaries (seen here in an aerial photo).
The effect of rainfall runoff over the millenia is especially evident in the numerous other alluvial fans spread over the valley pediment surfaces that formed when mountain streams dropped their loads as their gradients were abruptly lowered upon entering the valleys.
A TIMS daytime overflight along an E-W line on August 17, 1982 highlighted several of these arid landforms. We will examine separately images made from bands 1, 3, and 6 and a color composite of these together. A nighttime flight over the same areas was executed shortly thereafter. The three daytime images are displayed here side by side:
 |
 |
 |
| Band 1 | Band 3 | Band 6 |
They are oriented with north on the left side of each. The area covered is approximately that of the lower right quadrant of the Landsat subscene shown above. Visible in each are an outlier of the Panamint Range (bottom right) and a small segment of the Black Range (top right), two prominent alluvial fans (lower), the conspicuous dark and light fan on which Furnace Creek is located, darker alluvial fill in the basin and the sharply contrasting light tones of salt deposits. At first glance, the three bands seem similar to one another in their general tonal distribution. But subtle to sometimes notable changes in tone can be singled out when comparing equivalent points. Compare these tonal patterns with those from the night thermal IR overflight, seen here:
 |
 |
 |
| Band 1 | Band 3 | Band 6 |
Next, examine the day and night color composites made from these bands:
 |
 |
| Day Composite | Night Composite |
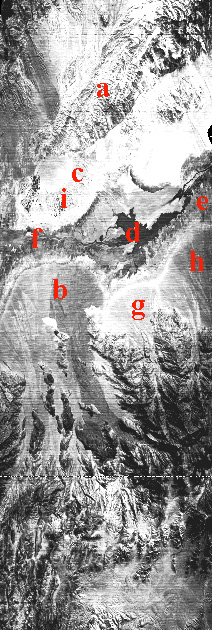
These images can be analyzed visually (qualitatively) in terms of tonal variations and colors. This is reported in the following table (letters locate features in Day Band 1 image):
| Day | 1 | 3 | 6 | CC | Night | 1 | 3 | 6 | CC |
|---|---|---|---|---|---|---|---|---|---|
| a. Mountains | m-d | m- d | m-d | mixed | l-m | l- m | l-m | mh-h | |
| b. West Fans | m | m&d | m-l | h | m | m | l | h | |
| c. Furn Crk Fan | l | l- m | m | vh | d | d | d | c | |
| d. Dark Fill | m | m | m- d | mh | l | l | l- m | mh | |
| e. Salt 1 | d | d | d | c | - | vague | - | - | |
| f. Salt 2 | l | m | l- m | w | - | - | - | - | |
| g. Interfan | l | l | l- m | h | l | l | m | h | |
| h. Fan Rim | m-d | m- l | d | w | l | m-d | d | mc | |
| i. Golf C. | m-d | m- d | d | c-mh | - | - | - | - | |
| Code: | A. Day - | l = light (tone); m = medium; d = dark | |||||||
| B. Night | c = cold (blue); m = moderate (green); w = warm (yellow); h = hot (pink to red); v = very hot (white) |
||||||||
A few comments: As one would surmise, the mountains (a) show variegated tones and colors owing to the variations in slope, aspect, elevation, rock types, and other factors. The large fans (bB>c) is rendered in lighter day tones and dark in all night bands; thus it is quite hot in the day composite and very cool in the night composite; this can be expected from loose unconsolidated materials that readily gain, then lose heat. The darker valley fill (d) absorbs heat in the day but retains it at night. The peculiar-looking salt deposit at e, easily separated in the visible Landsat image, is also distinguished by it dark daytime pattern and cool color in the composite. The saline area at the end of the Furnace Creek fan is less well defined and appears warm in the composite. Neither saline area (e and f) are easily picked out in the night band and composite images. A darker fan on the west side, referred to as "interfan" (g), is as warm or hotter than the fans on either side; its darkness (black body effect) infers a higher radiant temperature. The deposits just beyond the western fans (h) make up a band in the Landsat image that is moderately well-displayed in the day thermal images, being in darker tones, and are even more noticeable in the night images as dark tones. The Golf Course is not obvious in the day image and indiscernible in the night image; its mottled pattern probably results from grass on the fairways.
The above TIMS scenes are part of the data set acquired by JPL for their Death Valley Test Site. From those data they have also prepared a larger area TIMS scene that is much publicized. We reproduce that scene here,
noting that it was made by assigning TIMS 1 = blue; 3 = green, and 5 = red. Again, observe that alluvial fans appear in reds, lavender, and blue-greens, saline soils in yellow, and other saline deposits in blues and greens.
Another TIMS image superbly demonstrates the power of thermal remote sensing. The scene below extends across a series of basaltic lava flows coming
from the great shield volcano Mauna Loa on the big island of Hawaii. Most of the distinguishable flows have emerged from the volcano at various times in the last 200 years. The thermal differences sensed, as displayed by the selected colors, are due to several factors: variations in glassiness of the original flow; variations in surface textures and porosity; variations in degrees of weathering (mainly as a function of age) which are expressed in part by subtle differences in color imposed by surface alteration. In visible light, all these flows tend to be dark in reflectance owing to their inherent blackness but their radiant temperatures vary owing to the above factors.
Code 935, Goddard Space Flight Center, NASA
Written by: Nicholas M. Short, Sr. email: nmshort@epix.net
and
Jon Robinson email: Jon.W.Robinson.1@gsfc.nasa.gov
Webmaster: Bill Dickinson Jr. email: rstwebmaster@gsti.com
Web Production: Christiane Robinson, Terri Ho and Nannette Fekete
Updated: 1999.03.15.