 |
Seasat Image of Pine Mountain thrust |
All foreslopes (those facing the incoming beam, here from the image right) are shortened
to some extent in radar images. Visually, these slopes take on
an asymmetric form, with the facing slopes seeming to lean toward
the radar platform as though steeper. As depression angles increase,
the geometry of illumination is such that the slope lengths (top
to bottom) progressively decrease, thus increasing the degree
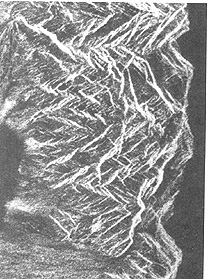 of foreshortening. In the extreme, layover - in which slopes appear as though inverted and laid over - occurs
when the look angle is less than the foreslope angle, causing
the top of a slope to send its returns before the slope bottom
does (the distortion is worst in near range locations). An example of this in mountainous terrain appears on the left.
Slant
range images may also show another geometric contortion, expressedas compression of regularly shaped features (square crop fields
may take on rhombus like outlines), maximum at near range positions
in flat terrain. These images can be converted to ground range
images if independent information on topography is known. Still
other distortions may be caused by erratic motions of the aircraft
during flight (which are nil from stable space platforms); these
too can be compensated by further processing.
of foreshortening. In the extreme, layover - in which slopes appear as though inverted and laid over - occurs
when the look angle is less than the foreslope angle, causing
the top of a slope to send its returns before the slope bottom
does (the distortion is worst in near range locations). An example of this in mountainous terrain appears on the left.
Slant
range images may also show another geometric contortion, expressedas compression of regularly shaped features (square crop fields
may take on rhombus like outlines), maximum at near range positions
in flat terrain. These images can be converted to ground range
images if independent information on topography is known. Still
other distortions may be caused by erratic motions of the aircraft
during flight (which are nil from stable space platforms); these
too can be compensated by further processing.
A simple glance at the two images affords an immediately obvious difference: ridges and valleys that trend N 30° E are strongly enhanced in the S 60° E image whereas similar features receiving illumination from the N 30°W direction are emphasized if their linear orientations cluster around the N 60° E trend. (Note, in both cases the sum of the two directions [as angles] is 90° ; in other words, illumination is normal to the trend that stands out.) Other features at varying orientations are visible in each scene but with subdued expression. As we saw in Section 2, this phenomenon - that linear trends are greatly influenced by illumination azimuth and angle - is quite pronounced in Landsat images, producing a directional bias. That is evident from the plots of fractures on azimuthal rose diagrams where the tendency for those oriented NE- SW (roughly normal to mid-morning illumination directions) to dominate the distribution of orientations. This can be an advantage in air radar imagery - the flight line directions can be chosen to underscore and accentuate certain directions of interest, or flight lines from several notably different directions can be flown to optimize detection of fractures in all orientations.
Code 935, Goddard Space Flight Center, NASA
Written by: Nicholas M. Short, Sr. email: nmshort@epix.net
and
Jon Robinson email: Jon.W.Robinson.1@gsfc.nasa.gov
Webmaster: Bill Dickinson Jr. email: rstwebmaster@gsti.com
Web Production: Christiane Robinson, Terri Ho and Nannette Fekete
Updated: 1999.03.15.