Landsat, and other space imaging systems, serve as mega-photos that depict large areas within which clues to subsurface conditions may be evident. In general, most of the obvious structures that have surface expression had been discovered and mapped (to varying extents) over much of the world. Some regions, however, were not adequately mapped even in the 1970s so that the advent of higher resolution space imagery proved a boon to energy companies seeking new sources of fossil fuels. Sometimes the imagery proved especially sensitive to subtle indications of interior structures: fractures around structures in known oil/gas fields may extend further, as seen in the coherent space images, than suspected from ground work; drainage patterns at broader scales may reflect control by underlying rocks involved in suitable traps; even vegetation distribution might disclose signs of structure. These and other indicators discernible in space imagery appealed to exploration geologists as still another means to survey large areas for promising prospects.
We will illustrate these ideas by examining and evaluating one of the first case studies using Landsat-1 to demonstrate feasibility of direct exploration from space. This study, conducted jointly by the Eason Oil Corp. and Earth Satellite Corp., shed considerable light on effectual criteria for recognizing conditions that might relate to buried hydrocarbons. However, some of the pitfalls associated with the space approach were also discovered by careful assessment of the results reported by these investigators.
The strategy behind the study was to look at a region already well-established as a petroleum province, with special attention given to finding telltale surface indications of the presence of known fields by inspection of Landsat imagery, both in standard-processed and in computer-enhanced versions. Rather than test capabilities in a region where there is obvious structural control and other clearcut evidence of petroleum occurrence, the decision was made to select producing areas in which the surface does not give clear indication of subsurface conditions. If it could succeed in detecting this presence under such elusive circumstances, Landsat would take on increased stature as an oil/gas discriminator .
The Anadarko Basin of south-central Oklahoma fits this requirement well. Located in the eastern Great Plains, with most of the land use given to farming and ranching, the Basin is one of the great producers of the mid-continent petroleum province that also includes much of Texas as well.
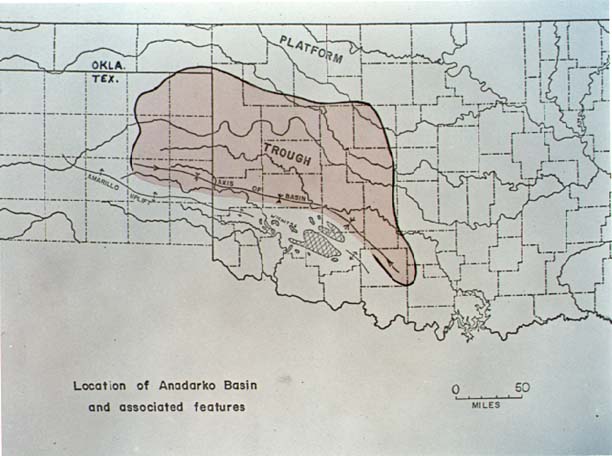
The Basin is a down-sag in the crust that has allowed up to 15200 m (50,000 ft) of Paleozoic sedimentary rock to accumulate. Structurally, the Basin is an asymmetrical geosyncline (a regional-scale downfold), with the deepest part near the south edge. Oil and gas are present in porous rocks associated both with structural (anticlines; fault blocks) and stratigraphic traps. Large gas fields occur mainly along the Basin's western half whereas oil is more common in the eastern half. Wells as deep as 7600 m (25,000 ft) have recovered both hydrocarbons, although most pay zones are between 2750-5250 m (9,000-15,000 ft).
Generally, surface expression of underlying oil or gas traps in the Basin is meager owing first to the lack of structural indicators in the flat-lying sediments atop older folded units and second to the overprinting of geologic features by vegetation and land use (grasslands; hilly sage-covered terrain; and wheat farmlands). The Eason Oil/Earthsat investigators decided to focus on two search elements: previously undiscovered fractures and subtle chemical alterations of surface rocks by escaping hydrocarbons.
Lineaments analysis was conducted by Eason Oil using Landsat image transparencies backlighted on a light table. The linear features they picked out is shown by lightweight black lines on the map below. Superposed as brown and green-black heavier lines are faults that had previously been discovered and mapped. As a geographic reference, note the meander bends (curved segments) of the Canadian River, traced in blue. The majority of the Landsat-mapped linear features are inconspicuous in the imagery; many are suspect, i.e., they could be non-geological or some type of lighting artifacts.
A group of four geologists, including the writer (NMS), in Code 923 at Goddard Space Flight Center decided to check on the reproducibility of these map results. Each person used the same transparencies (mostly winter images) as Eason Oil and worked independently of one another to minimize bias. When done, the tracings were registered to a base map on which the Eason Oil lineaments were also plotted, as seen here: The comparison disclosed rather startling discrepancies in terms of variance between the two groups. Only about 20% of the total linear features were found in common by both groups; Eason Oil chose approximately 35% exclusively while Goddard geologists chose the remaining 45% representing those "missed" by Eason Oil. One immediately suspects that this kind of result is partially due to considerable subjectivity in deciding whether a given linear feature a) really exists, b) is geological in nature, and c) means anything.
This suspicion was reenforced by a comparison of the linear features selected by the four in-house geologists. Here are the results - a mishmash that requires this interpretation:
Of the 785 linear features singled out by all four together, only 4 (0.5%) were identified by every operator. From the remainder, 37 (4.7%) were mutually selected by 3 operators, 140 (17.8%) by two, and 604 (77%) by only one (any one) of the operators. This type of result has been reported in similar studies, although the above scores were particularly discouraging. Each geologist had ample experience in photointerpretation and special skills in analyzing Landsat imagery; their choices were justifiable but results were questionable.
The bottom line here is that there often is a strong tendency towards overkill in choosing features that appear to be meaningful lineaments. So many are drawn that it would take a monumental field effort to check them out. If plotted as rose diagrams (see Section 2), they may indeed reveal valid trends for the orientations of regional fractures because statistically those of non-geological nature should be in the minority. (This was confirmed by a study of obvious lineaments in the Adirondacks; of the 200+ prominent ones that were field-checked, most proved to be either directly or indirectly controlled by geological fractures but about 20% were relatable to human factors [fence lines, roads, etc.]). Lineaments analysis is best combined with other indicators of mineralization or hydrocarbons. This would encourage the dispatch of geologists to particular sites to determine their presence and nature and their possible correlation with these indicators.
The Eason Oil study sought to recognize such indicators. Their interpreters delineated certain geomorphic anomalies such as circular patterns and unusual drainage. In the course of their image appraisals, they noticed unexpected tonal patterns that looked a bit like light-colored smudges on the images. These they called "hazy" features, as seen here:
Three typical hazy patterns are labelled A, B, and C. The one at A, at a bend in the Canadian River, is especially prominent, and occurs over a known oil field.
A standard false color subscene around A shows the hazy to have a bluish-white color similar to soils in barren fields; note the road pattern and white blotches which are access to producing wellheads. The yellowish areas coincide with unaltered Permian red beds.
When this April MSS image is processed into three ratio bands that are then combined into a color image (4/5 = Blue; 5/6 = Green; 6/7 = Red), the hazy feature at A takes on a unique yellow-green and the red beds become orangish.
From the multiseasonal data sets they had, only those scenes imaged
in late winter- early spring show hazies; at other times of the
year, vegetation masks the phenomenon. Their explanation of the
features can be appreciated by looking now at this photograph
of two rock types:
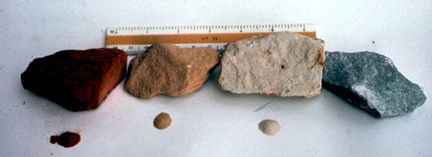
The rock on the far left is a sample from red beds (sandstones) of Permian age. Next to it is the same material that has been color bleached to yellow-brown (by conversion of iron oxide cement into hydrated iron oxides [analogous to rust]). The gray rock on the far right is a limestone (calcium carbonate); to its left is a rock composed of gypsum (hydrated calcium sulphate). Both interior rocks appear to be altered equivalents of the primary exterior rocks. In the field, comparable altered rocks can occupy many square miles in area.
To account for these hazy features, the Eason Oil people postulated that chemical reactions affected the iron cement or transformed the carbonates into sulphates when sulphur-laden gases or fluids leaked out of petroleum traps and rose towards the surface, interacted with susceptible rocks, and brought about compositional changes. About the time of their conclusion, evidence for such changes was reported as the doctoral thesis of Terrence Donovan (later of the U.S.G.S.) in which rocks above the Cement Field, at the southeast edge of the Anadarko Basin, were drastically altered by escaping hydrocarbons. Dr. Donovan found a pronounced set of anomalous values of the ratio of C13 to C12 in samples collected over both producing zones in the field, shown as contoured below:
These represent some of the highest departures from normal ratios known anywhere in the world. He attributed these values to the effects of chemical action by carbon-rich fluids on the rocks which, as a consequence, were altered to bleached states. Oddly, while evident on the ground, this alteration is not detectable in the Landsat imagery - possibly because it is not strongly expressed in derivative soils.
Accepting this alteration hypothesis, the Eason Oil group looked for at least partial coincidence between these hazies and the surface projections of subsurface oil or gas fields. Of the 57 anomalies they mapped in a control segment of the imagery, they claimed an association with 42 producing fields. Another six occurred above or near non-producing structures; only 9 showed no coincidence. If this observation stood up, then detection of hazies, sometimes correlative with lineaments concentrations, could promise a powerful new way to hunt for oil and gas using space imagery.
The author of this Tutorial, having converted to skepticism during graduate school, decided to challenge these findings. He traced the outlines of the Eason Oil hazy features (in a hachured pattern) on a transparency and then overlaid and registered it to the oil (pinks) and gas (blues) map of Oklahoma. The resulting combination is shown here:
Visually, the coincidence between hazies and fields does not appear strong. This was supported by a spatial correlation analysis which demonstrated there is no statistical significance to the pattern distribution, i.e., the coincidence is random rather than associative. In practical terms, there would be at least as much chance of striking oil by drilling into points selected by throwing darts at the map as there would be in drilling into the centers of hazies. Based on a quick field trip to the A hazy, the author (NMS) believes hazy features are areas where wind has blown away much of the soil fines, leaving reflective quartz grains behind.
These studies by the Goddard geologists were not done to discredit the Eason Oil study, which provided some valuable insights into both the discerning power of space imagery for petroleum exploration and the potential shortcomings of the apparent results. They were carried out to independently to evaluate this approach and to inject caution into any beliefs that this technique might become a panacea for finding petroleum. Suffice to close with the remark that since the launch of ERTS-1, the petroleum industry has found new oil and gas fields with the aid of space data and has developed criteria from the images that continues to prove worthwhile in planning and conducting exploration programs which are leading to payoffs.
Code 935, Goddard Space Flight Center, NASA
Written by: Nicholas M. Short, Sr. email: nmshort@epix.net
and
Jon Robinson email: Jon.W.Robinson.1@gsfc.nasa.gov
Webmaster: Bill Dickinson Jr. email: rstwebmaster@gsti.com
Web Production: Christiane Robinson, Terri Ho and Nannette Fekete
Updated: 1999.03.15.