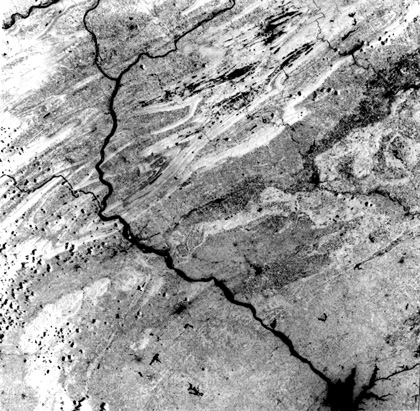
Taken on June 8, 1977, the image is bisected by the Susquehanna River as it flows into the Chesapeake Bay (bottom). Very dark blotchy areas in the lower central half include the towns of Lancaster, York, and Gettysburg. The upper left 40% is dominated by the tightly folded ridges of the Appalachian Fold Belt (see second full scene in Section 6); these show up a light grays (high reflectances) in this IR band. Just south of where the Susquehanna cuts through the anticline making up Blue Mountain lies the state capital at Harrisburg (identified in part by two thin black lines radiating eastward). In the Lebanon Valley to its east, some of the farmlands are discernible as blackish spots: these are fields in such early stages of planting that dark soils still dominate.
Look at the ridges north of Harrisburg. There are extensive segments of dark gray tones that bespeak of absence of reflective foliar leafing. This indeed is the absence of foliage, caused in this case by extensive removal by the widespread infestation of the Gypsy Moth that affected much of the Northeast U.S during the summer of 1977. The extent of this problem can be appreciated by comparing a late June, 1977 scene with one in July, 1976:
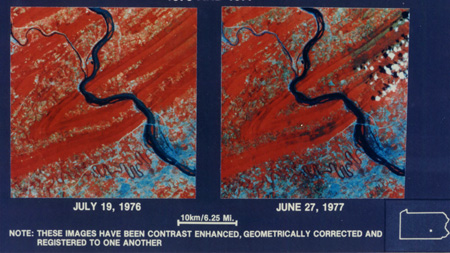
Patches of grayish-black, related to the ground showing through the stripped trees, in the 1977 scene are absent in the 1976 scene, when normal full leafing is displayed in uniform reds.
Landsat imagery proved a major economic boon to the Pennsylvania Dept. of Environmental Resources for monitoring the localization of moth damage across the state. To assess the extent of defoliation by conventional means, i.e., aerial photo-reconnaissance, would have cost in excess of a million dollars. But, reliance on just 16 Landsat scenes taken from May to July, purchased at $4000 each and processed for even less, provided all necessary details as to gypsy moth effects, allowing quick response spraying of those areas where the insects were most active.
Refer to the Band 5 image again. In the top center are some very dark elongate patches that seem to lie between ridges. These are spoil banks in valleys within the anthracite coal belt, site of the high quality coal mined for more than 100 years in northeaster Pennsylvania. The banks consist of rock waste and coal lumps and dust which produce dark surfaces (actually, on the ground this rubble is not too offensive to the eye, as vegetation has moderated its appearance); the waste comes both from underground and surface strip mining. An area near the top right of the Landsat scene is shown in color here as an enlargement:
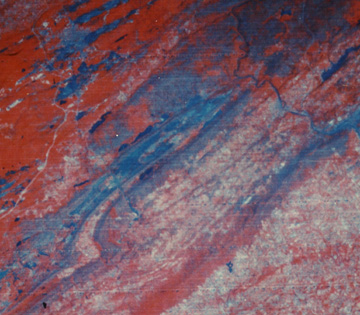
In this subscene, the Lehigh River cuts across the upper right and Interstate 81 runs past the town of Hazleton in the upper left. Areas covered by coal waste are rendered in dark blue; other areas in dark grayish-blue are gypsy moth defoliation patches. These similar appearing surface scars can be distinguished by supervised classification, as shown here:
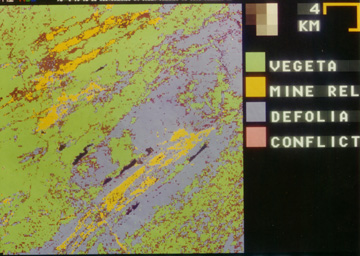
Thus, not only can Landsat efficiently monitor transient ecological maladies such as insect defoliation but, rather like our clearcutting examples, can follow long term changes in resource utilization such as strip mining and progress of land reclamation.
Many ecological problems - some are actual disasters - occur within very short time frames. Except in isolated wilds, forest fires usually burn for a few days until brought under control. A fire in the Fishlake National Forest near Beaver, Utah (about 60 km [40 miles] ESE of the White Mountain scene you will examine in Section 5) was imaged by the NOAA-9 AVHRR (1 km ground resolution) on June 17, 1996.
This false color composite was made by assigning the Channel 1 image to red, 2 to green, and 3 to blue. In this version, the grayish smoke shows as yellow and the fire itself, at the head of the smoke column, appears as bright blue. Major fires are commonly imaged both by meteorological and land-observing satellites and the extent of burn damage is easily assessed afterwards by the dark patterns in the visible bands (usually evident as bright patches in thermal imagery because of the blackbody effect [see Section 9]).
Of catastrophes of the purely natural variety, volcanic eruptions are a much feared and often unavoidable calamity to those living in proximity. Both the actual eruption and the aftereffects can be monitored by satellite (see p. 12-5). The 1980 explosion at Mt. St. Helens, in Washington State, is quite familiar to Americans (also on p. 12-5); the gradual restoration by plant regrowth in the ash deposits around MSH has been followed over the years in Landsat imagery. Overseas, major eruptions affecting populationsseem to occur every few years. The June 15, 1991 event at Mt. Pinatubo on the island of Luzon in the Philippines is a classic example. After almost 600 years of dormancy, earthquakes around it began in April of 1991. Their increase prompted evacuation of more than 50000 people. Just 3 hours before the main eruption, the billowing clouds of water vapor mixed with ash that foretold the impending climax were imaged (as a 3-band color composite) by the AVHRR on NOAA 7, as this material interspersed with clouds assosciated with Typhoon Yunga (top, below). The peak eruption (bottom), of the violent Plinian type, sent pumice, ash,
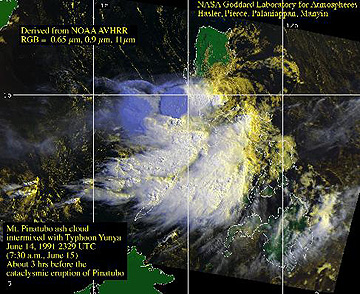
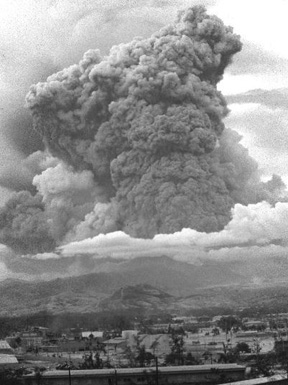
and chemical aerosols to heights above 40000 feet (12000+ meters), leaving behind a 2 km (1.2 mile) wide caldera (cavity) that displaced much of the summit. Sulphuric acid was a major constituent of the aerosols that spread worldwide, affecting weather and climate for the next 5 years. In the immediate vicinity, ash deposits surrounded the volcano to distances exceeding 20 km, destroying most of the heavy forests. That is evident in this before/after pair of images obtained by the Multispectral Electronic Self-Scanning Radiometer (MESSR) on the Japanese MOS (Marine Observation Satellite) operated by NASDA.
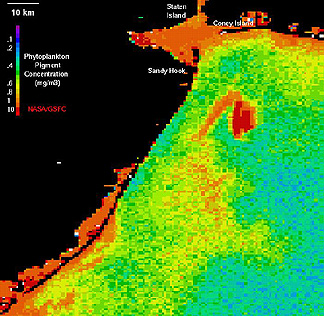
Two final examples, both associated with water pollution: The image below, made by the Coastal Zone Color Scanner (CZCS) on Nimbus 7 (see Section 14), shows the shallow shelf region of the Atlantic Ocean in the Long Island Bight south of New York City. For decades, a train of barges has carried waste materials (euphemism for "garbage") several times a week to a dumping site offshore. The barges then move in a zig-zag pattern that leaves a distinctive curlicue pattern readily apparent in this color composite image. (The same effect had been noted in earlier Landsat images.)
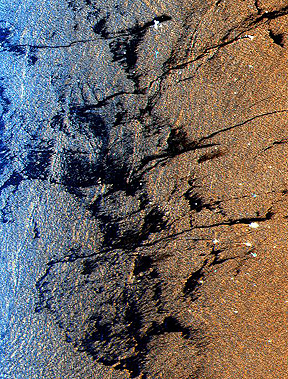
Another, much dreaded ocean contaminant is oil spills. Oil is noted for "calming the waters", i.e., reducing the degree of wave disturbance. Multiple oil leakages in the Arabian Sea west of Bombay, India are obvious in the SIR-C radar image beneath (their darkness is not due to the color of oil or absorption of light but to the decreased backscatter of the radar beam; see Section 8 for principles).
We will encounter other scenes and images in this Web Site in which agricultural, forestry and ecological applications are well illustrated (several appear in Sections 6, 16 and 17). Their text will introduce you to more of the possibilities that space imagery affords in monitoring and inventorying crops, grasslands, forests, and wetlands and other ecological niches. But, now let's take leave of the countryside and rural settings to examine another contrasting use - the appearance of cities and other land use patterns as satellite sensors can depict them.
Code 935, Goddard Space Flight Center, NASA
Written by: Nicholas M. Short, Sr. email: nmshort@epix.net
and
Jon Robinson email: Jon.W.Robinson.1@gsfc.nasa.gov
Webmaster: Bill Dickinson Jr. email: rstwebmaster@gsti.com
Web Production: Christiane Robinson, Terri Ho and Nannette Fekete
Updated: 1999.03.15.