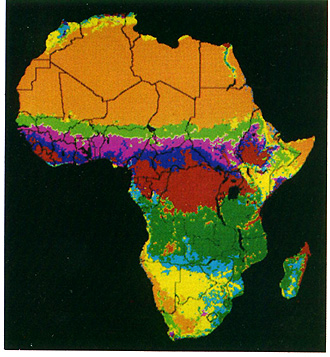
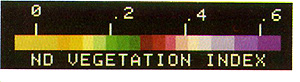
VI distributions for entire continents can be monitored in one view from geostationary satellites such as the meteorological satellite NOAA-7 (bands 2 and 1 of its AVHRR sensor are roughly equivalent to TM 4 and 3; see Section 14 for a review of metsat systems) . Using AVHRR data (and supporting ground truth) grouped into 21-day periods for 8 observing intervals from April 1982 through mid-February 1983, J.C. Tucker and his associates at NASA's Goddard Space Flight Center have produced, using Principal Components Analysis, a general classification of land-cover types for all of Africa. In the class map below medium blue = thickets and bushland; dark blue = interspersed tropical forests and grassland; purple = Sudan-type grassland and woodland; medium green = semi-arid wooded grassland and bushland; dark green = woodlands; yellow = deciduous bushland and wooded grassland; orange = semi-desert to desert; and red = tropical rainforest and montane forest.
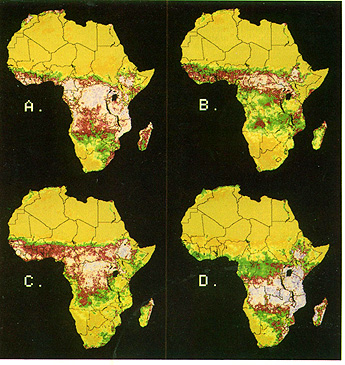
This group and others have continued to apply metsat AVHRR to observe seasonal changes in biomass ("green wave") over all of Africa, as illustrated below for these different dates: A. April 12-May 2, 1982; B. July 5-25, '82; C. Sept. 27-Oct. 17, '82; D. Dec. 20, '82-Jan. 9, '83. This has proved invaluable in determining crop shortfalls and drought conditions in Ethiopia and in areas of the Sahel (northern desert regions) during periods in the last decade where starvation was a mass threat. This observational technique has now been applied worldwide.
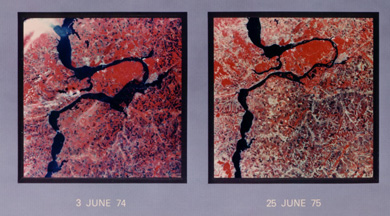
In the 1974 subscene that embraces a large bend in the Volga River, the fields around it show many to be already in normal crop stages. A year later, and 3 weeks beyond the '74 time in early June when maturation should have increased scene "redness", in fact much of the farmland is "fallow" (darker grays and tans) instead, confirming the drought claims.
Before leaving this agricultural theme, we want to expose you to one more example using a Landsat TM subscene instead of SPOT to show one of the most fertile and prolific growing areas in North America. This image of the Salton Sea/Imperial Valley
covers what is known as the Imperial Valley of California and a part of the Mexico at the northern end of Baja California. The town of El Centro (bluish-black patch) lies about 16 km (10 miles) north of the border with Mexico (very evident as a sharp contrast in intensity of agricultural activity); to the south is Mexacali.
This agricultural center extends south of the Salton Sea, a now saline body of water more than 49 km (30 miles) in length, that fills a basin about 82 m. (270 ft) below sealevel. This "Sea" was created through flooding by an overflow of water from the distant Colorado River (a small segment is visible in the upper right corner) shortly after the beginning of this century. Floodwaters poured through low dry washes, traveling westward more than 64 km (40 miles) to empty into the lowest part of the Coachella Valley. In this desert climate, that water is slowly evaporating and turning brackish (moderately salty) and is thus not suited for direct irrigation.
Today, water is transported through canals - the biggest in this scene is the obvious All-American canal - that tap the Colorado River. Mild winters promote year-round farming (up to three harvests) in the Valley, with cotton, sugar beets, lettuce, and citrus being the main crops. Most fields are in full growth in this April scene, as indicated by the bright, uniform reds. Differences in land use practice and availability of water (no major canals) account for the pronounced decrease in agriculture on the Mexican side. The lakelike water at the image bottom is Laguna Salada which undergoes seasonal drops in level that at times reach a dry state, exposing playa lake beds.
East of the Valley are the Chocolate Mountains, part of the Basin and Range system, against whose flanks are conspicuous alluvial fans. The bright strip in the right half of the subscene is the Algodones Dunes field, derived from beach sands left at the surface after an ancient predecessor to the Salton Sea had occupied the Salton Trough, a structural basin between the Coast Ranges (lower left) and the eastern mountains.
Code 935, Goddard Space Flight Center, NASA
Written by: Nicholas M. Short, Sr. email: nmshort@epix.net
and
Jon Robinson email: Jon.W.Robinson.1@gsfc.nasa.gov
Webmaster: Bill Dickinson Jr. email: rstwebmaster@gsti.com
Web Production: Christiane Robinson, Terri Ho and Nannette Fekete
Updated: 1999.03.15.