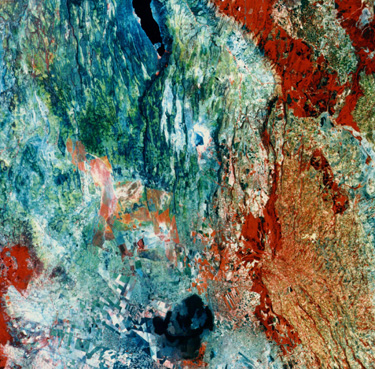
To test the merits of space imagery for finding fractures on Earth's continents, a region in which these are well exposed and reliably mapped was examined by the author as a ground truth site using both Landsat and SPOT scenes. The East African Rift is a zone of crustal extension in which part of the eastern African continent is pulling away from its parent along one arm separating the divergent blocks that stem from the triple junction centered in Ethiopia (the second arm includes the Red Sea and the third, the Gulf of Aden off the Arabian Peninsula). Much of the Rift consists of downdropped crustal sections bounded by deep-rooted normal faults (forming grabens) that cut into the basaltic lavas extruded in the resulting depressions. These lava fills have been further broken by a series of superficial parallel faults that, because they are recent and not severely eroded, have strongly expressed surface scarps. The scene below shows part of the Rift in Kenya (Lake Hannington is at the top) as imaged by SPOT (described in next section).
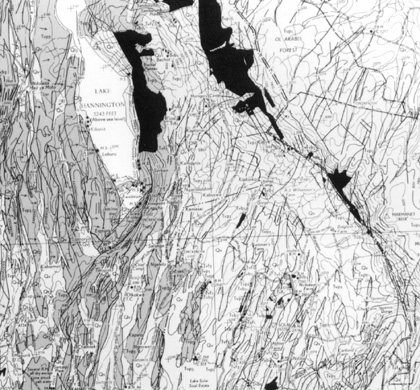
A map of rock units and fractures (most being faults) of the upper half of this image was made by Kenyan geologists from field mapping and aerial photointerpretation. It is reproduced here (at a quality that precludes reading details) to illustrate the reference database.
The next figure shows rose diagrams prepared by the author (NMS) from his interpretation of Landsat MSS and TM images and a stereopair from SPOT (see Section 11).
Areas west and east of Lake Hannington were treated separately - hence the two sets of diagrams. What is almost self evident is that, judging from the close similarity to the orientations in the diagrams representing the ground map, both Landsat and SPOT do an excellent job in defining the larger fractures - whose topographic expressions are so pronounced that shadow bias is minimized - allowing accurate measurements of their trends.
Lineament analysis using space images has been particularly valuable in determining regional and subcontinental fracture patterns that reveal some of the stress history imposed on large crustal units. Regions known as shields (surface exposures of deep crustal rocks, mostly igneous and metamorphic, that form the basement core of the continental craton) typically contain major sets of fractures developed mainly at the time of emplacement of the individual terranes that collided and assembled into this primary crustal units. In northern Canada, where soil and glacial cover are minimal, the shield there contains a very high density of fractures, seen in the image below.
These are strongly highlighted by two factors: 1) in this winter scene, the Sun's elevation angle is only 9°, so that the low rays emphasize small differences in topography associated with linear depressions, and 2) the snow cover here acts as a "dusting" which brings these features out much like a fingerprint is revealed by sprinkling a powder over it.
The author was part of a team at Goddard Space Flight Center that produced lineaments maps for selected areas within the Canadian Shield (which makes up most of the eastern 2/3rds of Canada) in an effort to better understand its structural history. Because glaciation scouring has removed covering soils and has sculpted lineaments into lakes, fractures over large parts of the shield are strikingly revealed, as demonstrated in this example:
The eye alone can tell that the terrain in the 40% of the image below the upper left corner is different from the remaining terrain to the south. The first terrain marks the Superior Province of the Shield, consisting of meta-igneous rocks whose ages go back beyond 2 billion years. The terrain to the right is the Grenville Province whose rocks are generally younger and were emplaced northwestward against the Superior Province some 900 million years ago along a line, known as the Grenville Front, of thrust faults seen from above as a NE-trending boundary. Many of the fractures in each province stand out as linear lakes; these were glacially-scoured gouges now filled with water. When the orientations of the lineaments are plotted in rose diagrams for each province, two characteristics emerge:
1) both provinces share a dominant east-northeast fracture trend and 2) the second maximum is NNE for the Superior (left diagram) and NNW for the Grenville (right diagram) Province. This example underscores the power of space imagery in providing observations well-suited to scientific analysis of regional structures.
Lineament analysis has a practical side as well. For example, fractures and faults can serve as channelways for circulating solutions that eventually deposit ore minerals. They also are involved in traps for oil and gas and can be instrumental in storing and moving ground water. Original or improved lineaments maps therefore yield economic payoffs.
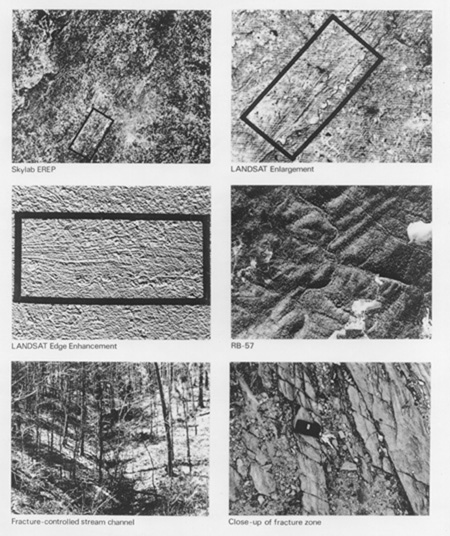
The upper left panel is a Skylab photo of Atlanta with the area being surveyed outlined in a box. To its right is part of a Landsat MSS image that brings out layered rock units in the Piedmont Province of the Appalachians. In center left, data from Landsat have been computer-processed by a technique known as edge enhancement that, as an end effect, enhances linear features by bounding them with a light-dark contrast. Here the strata are brought out in this way but also exposed are numerous parallel lines running across the strata from upper left to lower right (almost E-W when properly reoriented). These were suspiciously like a single prominent joint set. When seen in a high altitude aerial photo taken from an RB-57 aircraft, they show up as small linear valleys (right center) that, when visited on the ground, look as they appear in the lower left panel. When several of these joint valleys were "walked out" until they intersected the Interstate 285 Beltway, they could be followed into road cuts where exposures like that shown in the lower right panel identified them as fracture zones. The porosities associated with these zones make them favorable as potential aquifers for groundwater storage.
The area was drilled and large supplies of groundwater were proven. This led to an OK for development of the industrial park. The results of this study were brought to the Governor's attention. He was so impressed that he insisted on going into the field with the State Geologist to see the evidence first hand. A year later that governor became President Jimmy Carter, who was always a great friend to the Landsat program. This study also was cited in Congress as prima facie evidence of the value of space technology to the Nation.
During the first ten years of Landsat, its fullest use (as measured by sales of data to the user community) was in geology. Landsat, and later SPOT and other space systems including radar, became a much respected new source of information of particular interest to those who explore for oil and gas, mineral deposits, and groundwater. We will zero in on geological applications to resource exploration in Section 5. But first, in the next two sections you will be introduced to two other major application regimes: in vegetation monitoring and land/urban use assessment .
Code 935, Goddard Space Flight Center, NASA
Written by: Nicholas M. Short, Sr. email: nmshort@epix.net
and
Jon Robinson email: Jon.W.Robinson.1@gsfc.nasa.gov
Webmaster: Bill Dickinson Jr. email: rstwebmaster@gsti.com
Web Production: Christiane Robinson, Terri Ho and Nannette Fekete
Updated: 1999.03.15.