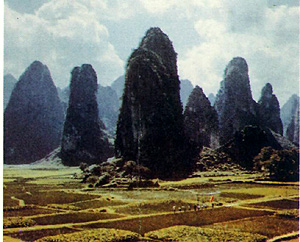

The karst topography in this scene is largely confined to the darker-toned surfaces. These are a thick series of carbonate rocks that elsewhere in the image have been stripped off to expose older non-carbonates below. The carbonate sequence is criss-crossed with two main joint sets that are enlarged into intersecting valleys. Drainage across these plateaus is now mostly internal, so that the region also contains numerous caves. This scene offers a remarkable illustration of how dissimilar rock types (which host different joint spaciings) give rise to strikingly varied topographic expressions and resulting landforms
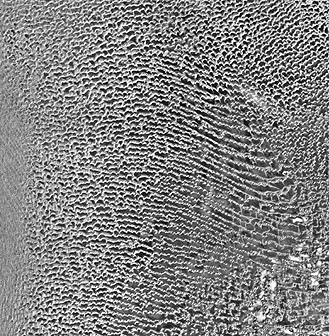
Lakes come in many shapes, sizes, depths, and modes of origin.
Most are freshwater but some may be saline owing to evaporation
that concentrates dissolved salts. Two extremes are shown here:

The first image shows elongate thermokarst lakes in the coastal plains ending at Point Barrow in northwest Alaska. The lakes tend to be ovoid and elliptical and are generally less than 6 meters (20 ft) deep. They result from collapse, slumping, and caving during the summer thaw of soils and sediments affected by permafrost - a condition in which groundwater in upper layers is permanently frozen to some depth excepting for upper layers heated in the warm season. The cause of elongation is uncertain but may be due to paleowind control at a time when winds came from the NW rather than today's NE.

The huge lake (more than 9000 km2) seen in the image above is the Salar de Uyuni in Bolivia, the largest salt playa in the world. A playa is a deposit of lake beds formed in an arid climate by rapid evaporation during dry season of wet season stream inflow causing sediment and salt deposits (evaporites) to accumulate over time. In March of 1973, the salar (salt pan) is partially filled with a meter or so of briny water (blue); some of the surface is uncovered salt (white) which in addition to NaCl (rock salt) and CaSO4 also contains LiCl making this the biggest source of lithium in the world. This, and the Salar de Coipasa (upper left), were once part of a much bigger lake that had formed in this part of the Altiplano province of the Andes during a rainier climate in the past.
There is a wide diversity of landforms characteristic of arid
regions and many images would be needed to show this range. We
elect here to show two examples of what most people visualize
when asked to picture the desert - sand dunes, usually in the
Sahara.
The largest active sand sea on Earth (560,000 km2) is the Rub'al Khali or Empty Quarter in the southern Arabian Peninsula. Loose sand up to several hundred meters in thickness covers most of the solid rock landscape in this region. In the Landsat scene on the left, six distinct sand fields, each characterized by particular types of dunes (distinguished mainly by shape), occupy the entire area. Of these four will be mentioned: Most of the center consists of Complex Crescentic Dunes on the left and Complex Linear Dunes on the right; in the lower right corner are Star Dunes; along the left is a separate sea consisting of small Linear and Complex dunes.

The above image is part of the Dasht-E-Lut or stony desert located in southeast Iran. Dominating the scene is a large but isolated sand sea containing linear or elongate star dunes with a prevailing northeast trend. The surrounding lowlands have gravelly surfaces. Along the lower left edge of this Landsat image are what appear to be dark streaks that orient towards the southeast. These are the eastern end of a big complex of long, narrow ridges called yardangs left behind when winds blew out soft clay/sand sediments leaving trenches whose increasing elongation served to control the eventual scooping out of the linear valleys that defined the residual yardangs. In this scene, exposed bedrock makes up low mountains to the east of the sand sea, from which streams carry and deposit dark rocks in a series of distributaries and fans.
Glaciation is commonplace in cool regions of the globe, both at
high elevations in mountains and in high (polar) latitudes. Ice
can cover nearly an entire continent, such as the Antarctic, or
a huge island like Greenland. When ice begins to flow under gravity
to lower elevations, usually along distinct, often narrow paths,
it becomes a glacier. Here are two examples of ice accumulation
and glacial movement:

The first image is a special false color processing, using yellow, red, and blue filters, to enhance various types of ice and glacial zones. It shows the thick ice cap (defined as a dome shaped ice mass with radial flow) known as Vatnajökull, which has 43 outlet glaciers (light blue), many with lobate termini. Areas in yellow-orange are vegetated; reds associate with basaltic rocks with sparse vegetation; green in the ocean is sediment; and black around the ice cap is a zone of ground soaking from glacial meltwater.

The image above shows typical alpine or mountain glaciers developed from snow fields covering the higher elevations of part of the Wrangell mountains of southeast Alaska. The range rises to 5043 m (16,390) ft at Mt Kennedy. Among the large glaciers are Nabesna (to the north), Kennecott and Rohn sending meltwater into the Chitina River, and Russell and Barnard coming off the eastern segment of the Wrangell group. Note the dark streaks in some of these piedmont glaciers: these are medial and lateral moraines (glacial debris that may end up as rock deposits). The reds in the scene are mostly tundra vegetation.
This ends our tour of highlight thematic images from Geomorphology from Space. You can see more, with detailed captions, in the Internet Site mentioned above or in the CD-ROM prepared by JPL. If you should check out the book as such, or the Web Site or CD, look at Chapter 11 that relates to an effort by Dr. Robert S. Hayden to demonstrate the value of Landsat imagery in geomorphic mapping. Examine particularly his Figures 11- 8 and 11-7, his geomorphic maps using Landsat of the Imperial Valley, Calif., and Tucson, AZ; we cannot reproduce these here because of small print. Although he was not the first to produce this type of map solely from space imagery (C.F. Pain's 1985 map of an area in New South Wales, Australia is the earliest known to the writer), he has put together excellent examples of this capability.
Code 935, Goddard Space Flight Center, NASA
Written by: Nicholas M. Short, Sr. email: nmshort@epix.net
and
Jon Robinson email: Jon.W.Robinson.1@gsfc.nasa.gov
Webmaster: Bill Dickinson Jr. email: rstwebmaster@gsti.com
Web Production: Christiane Robinson, Terri Ho and Nannette Fekete
Updated: 1999.03.15.