GEOGRAPHIC INFORMATION SYSTEMS (GIS)*
Maps are manmade derivatives designed to record information of various kinds about the spatial distribution of whatever is chosen as specific categories of features present on the surface. These categories are also referred to as attributes, which are general descriptors that are inherently non-spatial (depend on characteristics rather than the location). A given parcel of land, regardless of size, likely contains a diverse mix of features or characteristics that can be assigned to different categories; in other words, it has many attributes. A category can also be termed a theme; a wide variety of thematic maps may be needed to fully describe the contents of a surface. Thus, given an area of, say, one square kilometer (or mile), one such map may display road networks, another vegetation cover, a third dwellings or functional buildings, a fourth engineering properties suited for excavation, and so forth. Several themes may be combined on a (multipurpose) map, such as roads, buildings, recreational areas, etc. One common type of map is that showing land cover which identifies by an appropriate class or category whatever is displayable within map scale limits at selected points or locations throughout the area covered. A variant of this is the land use map that differs by concentrating on aspects of the cover involved in or of interest to human activities.
Examples of land cover or condition maps, each devoted to a single
purpose or theme, appear here for slopes, soils, and vegetation
distributed over the southern part of Washoe County in western
Nevada (the city of Reno lies near the center):
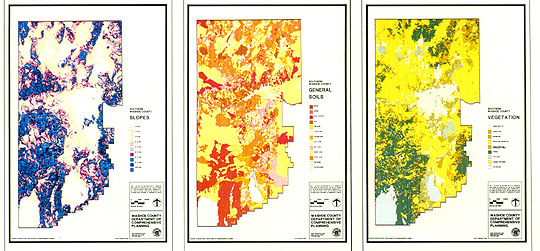
These describe natural states of either the surface itself or
materials underlying or on this surface. (Note: as these maps
are reduced to fit the Web page, information in their legends
becomes too small to read; the importance of the illustration
is in the differing patterns rather than the specific identifiers.)
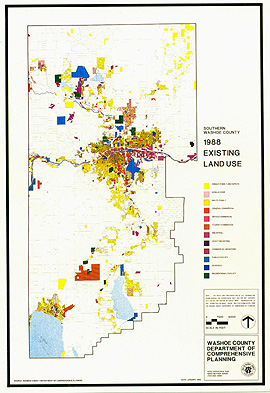
Much of the surface is undeveloped but areas where people have
constructed buildings to live, work, manufacture, or play in comprise
one form of land use, as shown in this map.
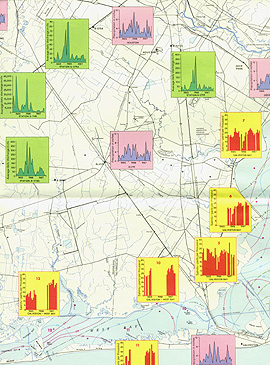
Some maps are composites of conventional spatial distributions
and graphs or other modes of data representation. Here is an example
showing an area between Houston and Galveston, Texas in which
average monthly rainfall for the years 1965-67 at selected localities
is plotted as bar graphs:
A comprehensive sampling of the many varieties of thematic maps
being used in practical geographic applications has been assembled
by the Environmental Systems Research Institute (ESRI) on one of their Web sites,
accessed here (http://www.esri.com/base/gis/index.html). Click on the list of 15 application categories at the bottom
of their home page to see some excellent examples.
Code 935, Goddard Space Flight Center, NASA
Written by: Nicholas M. Short, Sr. email: nmshort@epix.net
and
Jon Robinson email: Jon.W.Robinson.1@gsfc.nasa.gov
Webmaster: Bill Dickinson Jr. email: rstwebmaster@gsti.com
Web Production: Christiane Robinson, Terri Ho and Nannette Fekete
Updated: 1999.03.15.