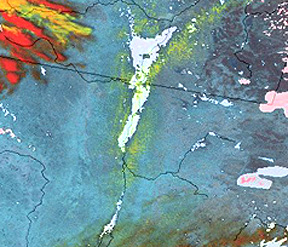
This kind of information was a factor in the prediction of major
flooding in the northern Midwest for later in the Spring of 1997. This
bore out with the great floods on the Red River in North Dakota
and Manitoba (Canada) that inundated Grand Forks, Fargo, and other
towns. The flood on April 27 was imaged by a NOAA AVHRR, with
light gray representing the water (clouds in orange):
Spring flooding is frequent in parts of the Mississippi River
basin. A hundred-year flood, i.e., largest expected statistically
in a 100-yr span, resulted from snow melt and rain in late March
of 1973, as captured in this Landsat-1 subimage (with an earlier
pre-flood view) on a cloudfree day, showing St. Louis, Missouri
(protected from downtown flooding) and the floodplains of the
Mississippi, Missouri (joined at A), and Illinois (B) river:

Twenty years later, the Midwest was again subjected to a flood
of even greater magnitude. After several months of excessive rain
that saturated the soil, owing to a blocking high that kept the
jet stream in a relatively fixed position, in late July and August
of 1993 water levels had risen well above flood stage. Areas hardest
hit were from Iowa to southern Illinois. Levees broke, inundating
tens of thousands of acres; the '93 flood became the costliestin U.S. history (some estimates approach $15 billion). This time
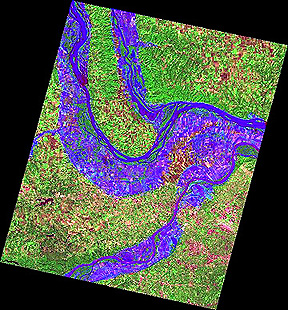
a number of good images were obtained by radar. Once again we
examine the lowlands northwest of St. Louis. One image taken by
the Shuttle astronauts using SIR-C appears on the top. On the
bottom is an image consisting of merged JERS-1 radar and a SPOT
3-band composite which offers considerable detail (notice how
farmlands show through the water).

The last image we present is a Landsat-1 subscene (February 6,
1974) of the Barcoo River in Queensland/South Australia in flood
from Fall rains. The floodwaters have spread out to widths greater
than 50 km (30 miles) in this plains with low rolling hills.

This lengthy Section 14 purports to convey the idea that, in keeping
with the widespread occurrence of water on the Earth's surface
(even greater than the 70+ % area topped by oceans stated on p. 14-1 if the ice
covering the Antarctic [which stores more than 80% of the world's {frozen} fresh water]
and Greenland are taken into account), the principal use of remote
sensing since the Space Age opened remains surveillance of the
weather systems and oceans at scales from local to global. At
this point in the Tutorial, we have now examined most of the specialized
modes of remote sensing (defined by the electromagnetic spectral
regions utilized), the spacecraft systems and programs that mount
the sensors, and the numerous and varied applications to which
these sensors have contributed. In the next section, on GIS, we
will learn of some systematic ways in which remote sensing data
are integrated into organization, correlation, interpretation,
and management of geographically-referenced information. Then,
in Section 16, we look ahead to the next generation of remote
sensing programs in which meteorological, oceanographic, land
surface, and biologic observations will be made by a series of
satellites dedicated to presenting a unified picture of the Earth as a System.
Code 935, Goddard Space Flight Center, NASA
Written by: Nicholas M. Short, Sr. email: nmshort@epix.net
and
Jon Robinson email: Jon.W.Robinson.1@gsfc.nasa.gov
Webmaster: Bill Dickinson Jr. email: rstwebmaster@gsti.com
Web Production: Christiane Robinson, Terri Ho and Nannette Fekete
Updated: 1999.03.15.