Obviously, metsats can provide near real time indications of weather
conditions that can be interpreted as forecasts of severe storms
and heavy rainfall. Over a longer period, potential flooding from
spring thaws can be predicted, and estimates of expected quantities
of water runoff made by repetitive monitoring snow cover over
large regions. Satellite observations of surfaces blanketed by
snow - in the U.S. principally in mountains and high prairies - suffice
to measure the areal extent of the masses likely to melt. Seasonal
variation in snow cover from year to year is illustrated by this
pair of Landsat-1 images of the central Sierra Nevada highlands.
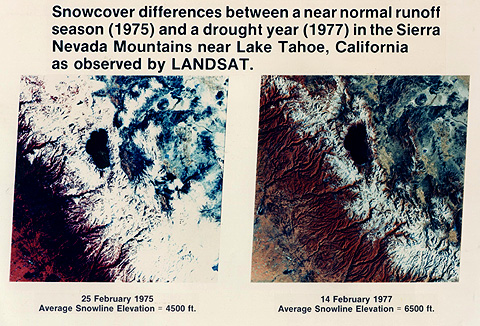
Thickness variations and packing densities must, however, be determined from onsite ground measurements in order to fix anticipated volumes. This information is important not only for flood warnings and control but also as an estimator of water supply from reservoir fillings, river channeling, and aqueduct retrieval.
Images from both the NOAA and the GOES satellites are used routinely
to determine extent of snow cover (snow can be separated from
clouds - both being highly reflective in the visible and photographic
IR - because of differences in spectral absorption in longer wavelength
bands; TM Band 5 also can distinguish snow/clouds, and thermal responses vary as well). Here is a color composite made from three NOAA-12 AVHRR
bands (1,3,4 = RGB) showing snow in April 1995 in the northwestern
U.S. as red:
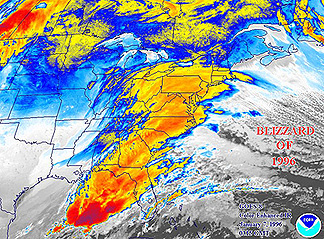
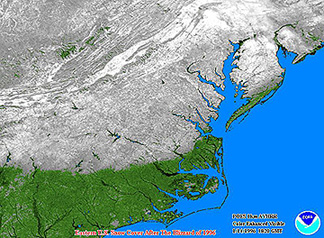
Major snow storms can bring about heavy cover that can cause extensive
flooding if a thaw sets in rapidly. Look (top, below) at this GOES-8 coverage
of a massive storm that hit the northeastern U.S. on January 7,
1996; the bottom image taken after storm passage and return of clear skies shows the extent of snow cover.
Its damaging effects were brought home to the writer (NMS) very quickly. A combination of ice followed by more than 50 cm (20 inches) of snow and then a rapid thaw led to basement flooding in his house (located on the side of a hill away from any floodplain). While the above images didn't play a role in this instance, it is almost "comforting" to see afterwards how violent was this storm and vast its output of snow.
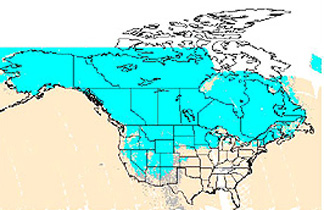
The National Weather Service keeps an up-to-date map of snow cover
for the U.S. as exemplified here for March 9-12 of 1997. This
map encompasses areas with snow but not every part of the blue-area surface
actually has a cover.
Code 935, Goddard Space Flight Center, NASA
Written by: Nicholas M. Short, Sr. email: nmshort@epix.net
and
Jon Robinson email: Jon.W.Robinson.1@gsfc.nasa.gov
Webmaster: Bill Dickinson Jr. email: rstwebmaster@gsti.com
Web Production: Christiane Robinson, Terri Ho and Nannette Fekete
Updated: 1999.03.15.