CZCS; SeaWiFS
The world's oceans (and its freshwater bodies as well) teem with life. Central to the marine foodchain is the occurrence of phytoplankton - microscopic plants that photosynthesize chemicals in sea water. This process depends on plankton content of chlorophyll a, a pigment that strongly absorbs red and blue light. As plankton concentrations increase there is a corresponding rise in spectral radiances peaking in the green. Upwelling masses of water (usually associated with thermal convection) containing phytoplankton take on green hues in contrast to the deep blues of ocean water with few nutrients.
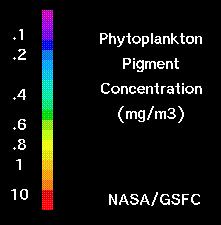
The Coastal Zone Color Scanner (CZCS) is a sensor specifically developed to study ocean color properties; it was launched in October 1978 as part of Nimbus-7's instrument complement and continued to operate until late 1986. Colors in the visible were sensed by four bands, each of 0.02 µm bandwidths, centered at 0.44 (1), 0.52 (2), 0.57 (3), and 0.67 (4)l µm. A fifth band between 0.7 and 0.8 µm monitored surface vegetation and band 6 at 10.5-12.5 µm sensed sea surface temperatures. In monitoring ocean color, Band 1 (blue) measures chlorophyll absorption, Band 2 (green(, chlorophyll conentration, Band 3 (yellow), is sensitive to yellow pigments ("gelbstoff"), and Band 4 (red), reacts to aerosol absorption. Chlorophyll variation, which correlates closely with relative abundance of marine phytoplankton, is calculated as the ratio of band 1 to band 2 (for phytoplankton concentrations less that 1.5 mg/m3) and 2 to 3 (>1.5 mg/m3).
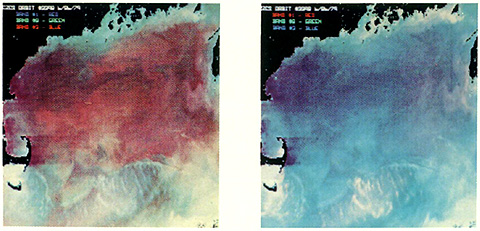
The next pair of images are CZCS color composites: the left one
emphasizes chlorophyll-enrichment (in reds) in the Georges Bank
off the New England coast (BGR = 3,2,1) whereas the right one
simulates natural ocean color (BGR = 1,2,3)
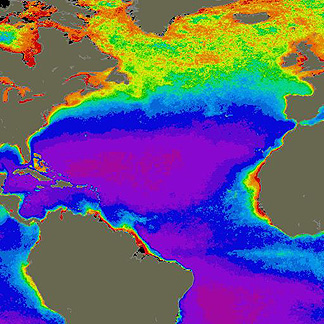
Using data from all relevant bands, chlorophyll concentrations
spread over the Fall to Spring season in 1978-79 in the Atlantic
Ocean are shown below:
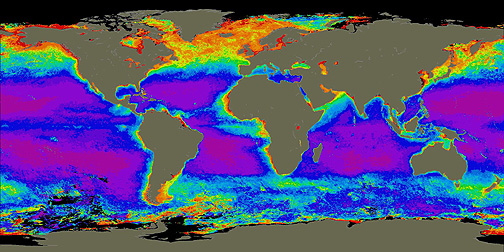
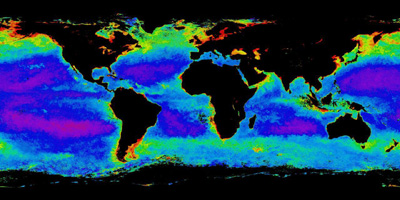
The distribution of chlorophyll on a global scale averaged between
1978 and 1986 appears here:
Thermal data from CZCS can be correlated with chlorophyll, as
demonstrated in this plot:
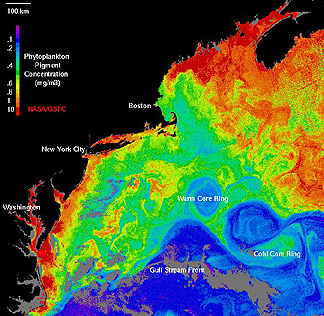
In the color coding used, blues correspond to warmest and reds
coolest temperatures. Note the eddies or rings. Phytoplankton
tends to concentrate along the edges of warm core rings (which
experience clockwise rotations) but are enriched centrally in
cold core rings (ccw motion); the motions in these rings are analogous
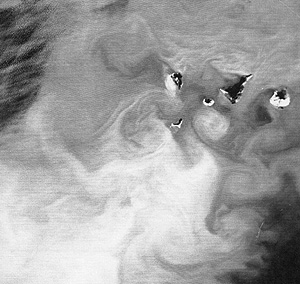
to circulation around atmospheric highs and lows. Warm core rings
can extend over several hundred kilometers, as seen in this HCMM
Night-IR thermal image (below, top) off showing such "gyres" in
varying stages of development and coherence in Atlantic waters
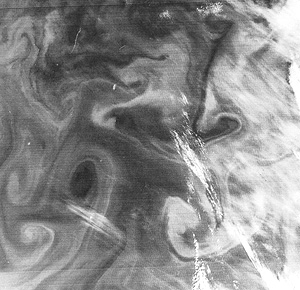
around the Canary Islands off the African coast. Cold core rings
may be less well organized in shape but with many individuals,
as displayed in this June 19, 1976 Landsat-1 Band 4 image (bottom)
of waters off the southwest coast of Iceland; the lighter tones
are thought to be "murkiness" due to large concentrations of phytoplankton.
These types of observations - ocean color and thermal patterns - aid in locating conditions where large schools of fish are likely to associate and are actively applied to point commercial and sport fishermen to the best current fisheries.
The follow-up to the CZCS is NASA Goddard's SeaWiFS (Sea-viewing
Wide Field-of-View Sensor), launched successfully on August 1,
1997. Once again, the sensor system is dedicated to monitoring
ocean color variations, especially those caused by concentrations
of plankton and other sealife that strongly moderates chlorophyll
response detectable spectrally. Thus, the prime objectives are:
1) to quantify ocean primary production; 2) to determine observable
couplings of physical/biological processes; and 3) to characterize
estuarine and coastal ecosystems. The prime sensor is shown here:
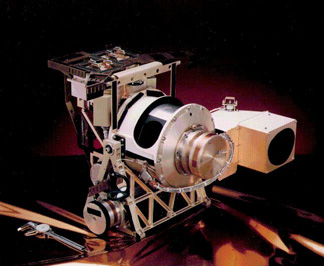
The sensor consists of 8 channels at: 412, 443, 490, 510, 555, 670, 765, and 865 nm (nanometers: 1 µm = 1000 nm), each with band widths of 20 or 40 nm. The instrument can swing ±58¡ off nadir. From an orbital altitude of 705 km, spatial resolution in the LAC (Local Area Coverage) mode is ~ 1.1 km (optimal of 0.6 km at nadir), and in the GAC (Global Area Coverage) mode it is 4 km. Swath widths are: LAC = 2801 km; GAC = 1502 km.
Here is a characteristic regional map showing SeaWiFS-derived
chlorophyll content for the globe using data recovered from Sept.
4 through Nov. 20, 1997, using the same color coding as CZCS:
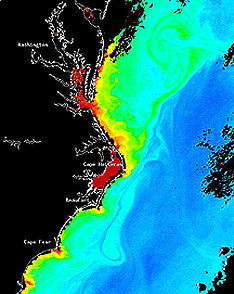
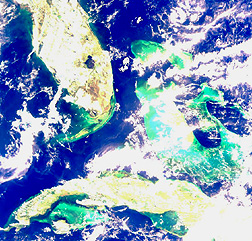
The next two images show (top) chlorophyll mapped off the eastern
U.S. coast on Sept. 30, 1997 and (bottom) ocean color off southern
Florida on Sept. 25, with greens denoting high phytoplankton concentrations.
The sensor data from SeaWiFS can also be used to map land surfaces on a local to global scale. A global true color map of the Earth was shown near the end of the Introduction Section. Further information about SeaWiFS is available online at: http://seawifs.gsfc.nasa.gov/SEAWIFS.html
Code 935, Goddard Space Flight Center, NASA
Written by: Nicholas M. Short, Sr. email: nmshort@epix.net
and
Jon Robinson email: Jon.W.Robinson.1@gsfc.nasa.gov
Webmaster: Bill Dickinson Jr. email: rstwebmaster@gsti.com
Web Production: Christiane Robinson, Terri Ho and Nannette Fekete
Updated: 1999.03.15.