In recent years, the term hyperspectral has come to apply to spectral curves that are either continuous over a broad range, such as the Wyoming group, or consist of large number of individual narrow wavelength (high spectral resolution) channels that are so close-spaced that they constitute an almost quasi-continuous spectrum. Until the last decade (see AVIRIS described below), it was technically very difficult to operate a spectrometer from fast-moving air and space platforms because of the inability of the instrument to dwell on a small target (IFOV) long enough for the full spectrum to be scanned. This is the main reason why Landsat, SPOT, and other sensor systems have had to use broad wavelength bands that integrate the variations in spectral intervals into single values for the reflectance ranges they represent.
Use of spectrometers and related instruments in the field have the advantage of looking at surfaces that contain the mix of individual components that make up the classes that are of usual interest (remember the usual constituents in a field crop). It is often possible to obtain spectra for each component and then back away to get the full mix; this collection of component spectra assists in interpreting the mix response. Also, illumination conditions from solar irradiation, plus diffuse skylight and multiple reflections from ground surroundings that can contribute 10 to 25% of the total, during sunny or even overcast conditions are duplicated in the outdoors. One of the simplest devices is a hand-held 2 or 3 band radiometer, such as the one held by the writer (NMS) in this illustration:
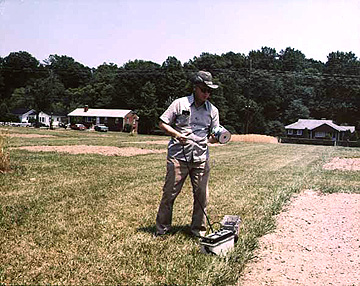
The instrument has its own portable power source and recording system. The spectral bandwidth is typically 0.05 to 0.10 µm. Common channels are in the green, the red, and the near-IR. These are especially pertinent to calculating Vegetation Indices (Section 4). Readings can be taken at various look and solar angles, and on different dates and times of year to provide records of spectral variations in the same test areas. These variables can have a pronounced effect on the character of the spectral response, and hence the interpretation of changes, as indicated in this plot of bidirectional reflectances showing the variation of IR/red band radiances as a function of view angle and azimuth (compass) direction:
In general, spectra of rocks show much less variability owing to bidirectional reflectance effects than does vegetation; for forests, irregularities in canopy shape, leaf or needle shapes, and species mix can have notable influence on response as a function of viewing and illumination geometry. Portable field spectrometers are now in common use. This is a typical setup for a reflectance spectrometer developed by the Jet Propulsion Lab (JPL) in the mid-70s.:
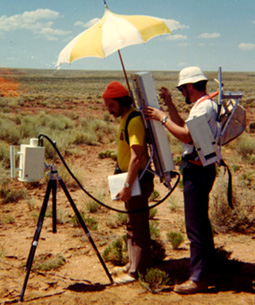
For this instrument, the reflected light is gathered in an optical head and passed through a filter wheel operating between 0.4 and 2.5 µm onto a cooled detector (PbS or lead sulphide). The backpack contains a power source, amplifier, and recording (analog to digital) assembly. After the ground target scan (in 30 seconds or less) is complete, the operation is quickly repeated on a a flat reference plate made of a high reflectance (near white) material; sometimes a black plate is used as well to fix both ends of the reflectance range. Over a brief time span, the scene lighting will likely remain about the same but over longer periods changes in clouds, sun angle, etc. will cause variations in spectral response. However, by dividing the target readings with the reference values, the spectra will be normalized. The assumption here is that variations in irradiance over a series of paired readings taken minutes to hours apart are cancelled out since differences in the illumination conditions will affect both target and reference in the same way at each sampling time . To exemplify, if at time 1 at some wavelength the target reads 30 and the reference 90 and at time 2 they read 20 and 60 (percent), the normalized spectra are both 0.33 (33%) in reflectance units. Field (in situ) reflectance spectra of rocks (1 - 5) and ponderosa pine (6) acquired by this instrument are shown here:
JPL, a leader in developing ground truth instruments, developed a portable field emission spectrometer that uses argon-cooled mercury-cadmium-telluride (HgCdTe) detectors to sense thermal IR responses in the 5 to 15 µm spectral region. In keeping with the trend toward using linear array multispectral systems (e.g., SPOT) instead of scanners with filters (Landsat), some field spectrometers today utilize a fixed grating that spreads radiation over a range of angles onto array detectors made of indium-gallium-arsenic (InGaAs) alloys capable of more rapid scanning and greater sensitivity. For further insights into field spectrometry, consult the review found within the Home Page prepared by Analytical Spectral Devices, Inc., a company founded by Dr. Alexander Goetz (formerly at JPL), a leader in this field.
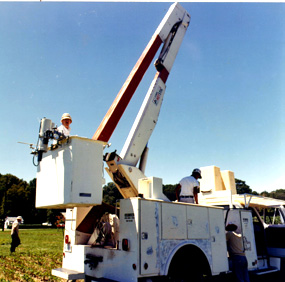
Another approach is to operate a spectrometer from a truck in which the sensor head is mounted on a movable cherry picker, as illustrated below. This allows the IFOV to be varied in height so that larger surface areas can be examined.
Often the most valuable supporting data are obtained from sensors mounted on aircraft that fly over study areas. In remote sensing programs administered by NASA, test sites are specified by investigators for ancillary data acquisition or by system developers to test prototype ("breadboard") instrument and sensor designs being proposed for future missions. Such research missions help to determine the spectral and spatial resolutions, the signal to noise (S/N) response, and the time of day and year that optimize detection and identification. Part of an earlier fleet of airplanes used for these purposes is pictured here:
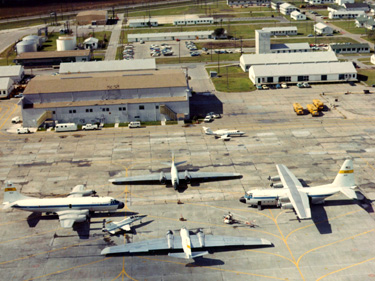
The large plane on the left is a Lockheed Electra that operates up to 7600 m (25000 ft). On the right is a C-130 capable of higher altitudes. The two center planes are U-2's (designated ER-2s) that can reach to 19000 m (62000 ft) (not shown is the RB57, another jet capable of high flight levels). The small jet inside the group is used primarily for support whereas the jet near the hanger has sensors for lower altitude missions. Among the compliment of sensors are one or more film camera systems (including multiband arrays) , multispectral scanners (including those using charge-coupled detectors [CCDs]), thermal IR scanners (such as TIMS, see Section 9), microwave sensors (including radiometers and scatterometers, and multiband radar), and special request equipment not routinely flown.
At the other extreme, there is often a need to collect continuous data on the ground at widely separated stations or over extended time periods, often from inaccessible areas. Costs from repeat trips and other factors may preclude sending field parties after initial visitations. With such requirements, it may be expedient to set up automated remote sensing sampling sites at which measurements of several defining properties are obtained constantly or at fixed intervals.
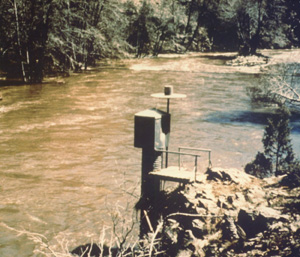
To accomplish this during the Landsat program, Data Collection Platforms (DCPs) have been deployed to measure certain properties on site, coding the results and transmitting these by radio whenever Landsat or some other satellite is in line of sight and then relaying the data to appropriate ground stations for processing. Typical remote field measurements include: 1) stream heights and velocities; 2) silt loads; 3) snow pack densities; 4) meteorologic parameters; 5) point source pollution; 6) seismic disturbances, and 7) surface tilting on volcano slopes. Networks of remote stations are now in common use in the U.S. and other countries, such as this example of a stream hydrograph and its transmitter:
We have demonstrated so far in this Tutorial that remote sensing is an efficient way to gather large quantities of information from vast aeas without actually having to be on the observed surface. But, this knowledge will seldom be effectively applied unless the interpreter has first-hand familiarity with the surface of interest, or at least with models of such a surface. This intelligence is secured by several means -- from circumspect field observations, judicious investigations at training sites, sophisticated measurements in the laboratory, on the ground, in the air, and from space, and, ultimately, from a rigorous mathematical analysis of the data to test for validity and correlation.
Code 935, Goddard Space Flight Center, NASA
Written by: Nicholas M. Short, Sr. email: nmshort@epix.net
and
Jon Robinson email: Jon.W.Robinson.1@gsfc.nasa.gov
Webmaster: Bill Dickinson Jr. email: rstwebmaster@gsti.com
Web Production: Christiane Robinson, Terri Ho and Nannette Fekete
Updated: 1999.03.15.