Examples of Imaging Spectrometer Products; Multisensor Analysis
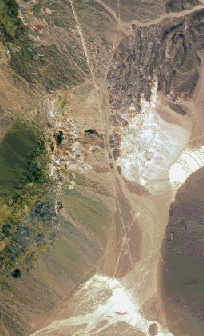
By now, hundreds of missions designed to test and utilize imaging spectrometers have been flown, with many imposing images generated from the data. Still one of the most successful and instructive among these were NASA AVIRIS flights over Cuprite, Nevada. The data have been reduced and manipulated by JPL and the Spectroscopy Group at the U.S. Geological Survey in Denver.
The Cuprite mining district lies near Tonopah, NV in the southwestern part
of the state. Gold and copper have been mined from here for more than a century.
As a study site to evaluate the value of remote sensing, in particular with
hyperspectral data sets, for mineral exploration, it is one of the better
areas to examine because of the wide variety of telltale alteration and other
mineralization.
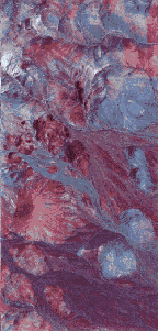
By way of comparison, the next image was made with the HYDICE
sensor. This false color combination consists of Red = Channel 175 (2200 nm),
Green = Ch. 125 (1650 nm), and Blue = Ch. 50 (650 nm). The area covered includes
part of the AVIRIS scene but includes other features.
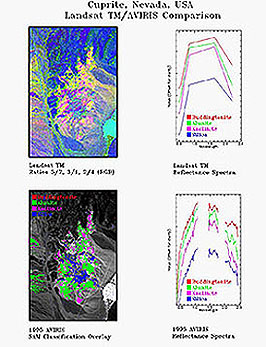
The next image (at rather blurred resolution) shows part of the AVIRIS scene (bottom) in a color-coded classification of four minerals and a TM band ratio (R = 5/7; G=3/1; B = 2/4) image of the same area, together with plots of the spectral curves obtainable by each system:
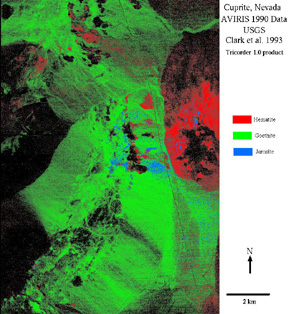
Specific AVIRIS channels (one, or several contiguous ones lumped together)
can be selected to rely on specific absorption bands from which values images
can be derived from combinations of three channel sets. Here is an image in
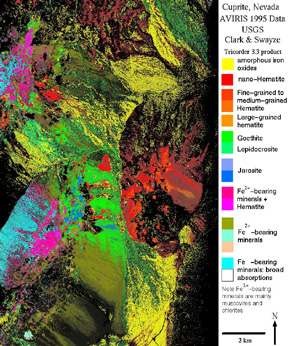
which the colors represent the iron minerals Hematite, Goethite, and Jarosite.
The Goethite occurs mainly as stain or pigmentation in the alluvial materials
in the valley and along slopes. (Black is unclassified).
By judicious selection of channels extending into absorption bands that are indicators of particular mineral species or groups, most of the alteration-related minerals at Cuprite have been identified and mapped. This next map extends the location of iron-bearing minerals which have many of their diagnostic bands in the 400 to 1200 nm range.
This map differs from the previous one (above) in subdividing Hematite and Goethite according to crystallinity and in including other iron minerals as distinguishable chemical phases.
An even more diverse assemblage of minerals can be recognized using bands within the 2000-2500 nm range. A large group of silicates, carbonates, and sulphates have been detected at Cuprite by AVIRIS, as shown in this map.
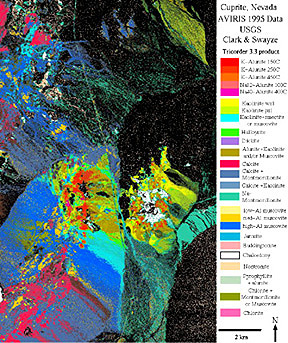
As taken off the Net, the image resolution was only 72, which blurs the names of the minerals in the legend. But of special interest is the mineral Buddingtonite, shown in fuchsia (a peach pink), which occurs in a few patches on the map. Buddingtonite is a rare form of the common potash-feldspar group; the K+ is partially replaced by the ammonium ion NH3+. This map is an exciting exemplar of the ability of high resolution hyperspectral data to reveal a notable diversity of minerals in alteration zones and fresh rock as well, at a detail that could require years of field mapping to duplicate.
Turning now to examples from other disciplines and subjects, we will display several images touching on these, with minimal comment.
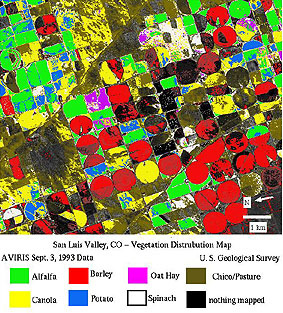
The AVIRIS image below shows a group of crops in both circular and rectangular fields. The area is near Summitville, Colorado. Note that the identified crops correspond to those shown on page 13-6 as first a figure displaying spectral curves for a series of crops and just below it continuum-removal plot of the same series. These were derived from the same data set used to generate this image.
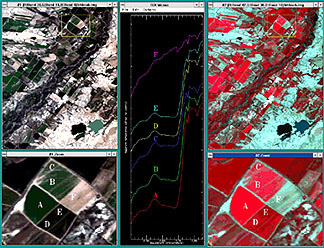
In the next image, natural and false color images of field crops around Greybull, Wyoming, in the Bighorn basin, are shown. The offset spectra in the middle match with the several crops and features, labelled by letter, present in the enlargements but the source of this image does not contain identification of types.
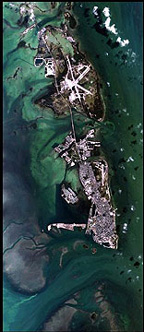
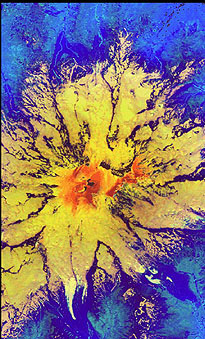
AVIRIS observations focusing on water features appear in the
next two image. The top is a natural color view depicting part of Key West,
Florida and the shallow waters around it that cover coral reefs. Below it
is a view of snow (yellow) and water vapor (blue, but land features persist
beneath it) capping and surrounding Mount Rainier in northwestern Washington
State.
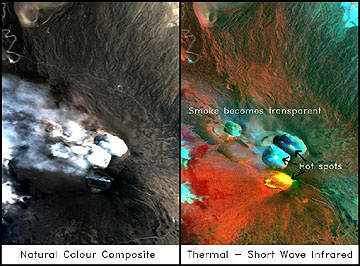
The DAIS instrument, as earlier stated, has thermal channels as well as ones in the Visible and SWIR. Here is an intriguing aerial oblique view made with that system, showing a natural color image on the left and a SWIR-thermal image on the right, of Mt. Etna in Sicily during one of its active periods. Smoke obscures some details of volcanic features in the natural image that "shine through" in the SWIR-TIR rendition.
Before closing this subsection that highlights the rapidly growing use of imaging spectrometers, brief mention will be given to another burgeoning - and loosely related - field of remote sensing. This is what is now called "multisensor analysis". The term refers to combining data obtained by more than one type of sensor on a spacecraft or, more commonly, by sensors on different spacecraft. For example, a study area may have been imaged at various times by Landsat, SIR-C, TIMS, SPOT, MOMS, and AVIRIS. Of course, each data set, and imagery derived therefrom, can be examined independently. Or the visual products can be laid side by side. From this multiset, interpretations can be made by simply looking at the imagery at various aspects of scene content. This is standard procedure in conventional photointerpretation.
Or instead, as we have seen in several images shown elsewhere in this Tutorial, two or sometimes more data sets can be merged or registered to form a single image composed of combined images. Landsat and radar data are good examples. Landsat provides a color rendition of the surface cover; radar provides a sense of topography or relief. Another example uses DEM topographic data, in digital format, to create a quasi-3D perspective view of a SPOT scene.
Somewhat more sophisticated is the approach that uses each sensor data set as input to classification. Thus, visual and SWIR bands from AVIRIS can be combined with TIMS thermal data so that as many as 10 to 12 or more band values contribute to the multivariate analysis that leads to a classified scene or map likely to have improved accuracy. And, of course, other kinds of data can be digitized and combined, as using aerial photography or using thematic maps (described in the review of Geographic Information Systems in Section 15).
The trick to doing meaningful multisensor analysis lies in properly registering a variety of data sets. These may have been acquired by sensors mounted on several platforms: this leads to multidimensional data characterized by different pixel sizes, viewing geometries, orbital or flight line paths, times of year, angles of illumination, etc. Techniques for registration have evolved over the years: one example is the superposition of multitemporal Landsat data; another involves combining day and night HCMM images (from orbits inclined to each other). Automated Multisensor Registration can now be done conveniently using computer- based algorithms that register to a common geocoded base, integrate tie-point features, make geometric corrections (rectification), and resample pixels to a common size.
It is becoming increasingly clear that, with the proliferation of sensors and their platforms (satellites) in space, the systematic combination of data acquired over a wide range of wavelengths, scales, and temporal conditions will result in a strongly synergistic utilization of the valuable data sets each operating system provides.
Code 935, Goddard Space Flight Center, NASA
Written by: Nicholas M. Short, Sr. email: nmshort@epix.net
and
Jon Robinson email: Jon.W.Robinson.1@gsfc.nasa.gov
Webmaster: Bill Dickinson Jr. email: rstwebmaster@gsti.com
Web Production: Christiane Robinson, Terri Ho and Nannette Fekete
Updated: 1999.03.15.