TOPOGRAPHY FROM SPACE
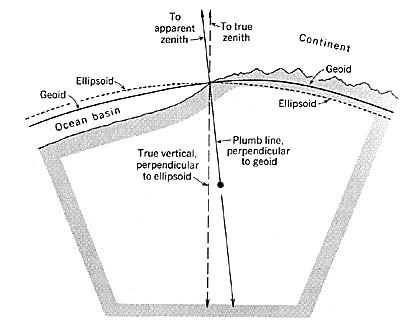
We all know that the Earth's surface is not flat over large distances, and commonly, not even locally. The surface continuum of the Earth's "sphere" is variably curved or undulating with respect to some reference shape. In fact, measurements have shown that the gross shape of the Earth is not a true spheroid, i.e, all points on the surface are not equidistant from the geometric center, but is instead an oblate ellipsoid in which distances from the center to the polar regions are slightly less than those to its equatorial belt, owing largely to the outward bulging of its internal materials in response to centrifugal forces developed by global rotation. This ellipsoidal surface is further modified by differential responses to the distribution of different masses, especially those located in the crust and outer mantle. This gives rise to the geoid, a figure in which the surface can broadly curve under or above the ellipsoid as gravity pulls these varying masses inward centripetally to different degrees. The geoid is by definition the shape assumed by the Earth's globe that would hypothetically occur if gravity were constant at all points on its surface; in the oceans this shape is almost coincident with mean sea level (see below). Departures of geoidal surfaces from the ellipsoid , which worldwide tend to range between about -100 to +70 meters, are determined by techniques of geodesy. These initially included gravity measurements in the field and over the last 40 years have depended on refinements resulting from variations in satellite orbits responding to gravity. Even this shape still does not precisely characterize the "true" state of the surface because ocean levels can change slightly from place to place owing to winds piling up water, thermal expansion, tides, etc. and land shapes are further modified by tectonic and isostatic deformation and by erosion that raise, lower and incline actual surfaces relative to the geoid . On land, in particular, these changing positions of the surface can be out of "sync" with the locations they should assume if ideally adjusted to gravity. The relation between the surfaces associated with the ellipsoid, the geoid, and the land/ocean bottom surface is evident in this diagram in which a cross section through a part of the outer global interior shows the smooth curves for the two "oids" and the irregular profiles that generalize ocean floor and continental surface outlines.
Cartography is the specialty that maps the actual surface of selected areas of the Earth onto (conventionally) paper sheets. A planimetric map shows locations and features on the surface, which may be at different heights above or below a reference (datum) plane, in their relative positions as though projected onto an X-Y (horizontal) coordinate system. Each point on the map corresponds to a point on the Earth surface. These surface points, however, are distributed on curved surfaces that make up the near-sphere of the globe. The points can be referenced to some type of geographic coordinate or grid system, the most common being that of latitudes (parallels, being successively smaller circles relative the the equatorial circle going poleward) and longitudes (meridians, great circles of equal radius that pass through the poles). There are representation problems when these points along a curved (topologically distorted) surface are projected onto the map plane. This must be addressed by some type of transformation between spherical and planar geometry. This involves some specific projection that systematically transfers the points to a reference surface, such as a cylinder enclosing the globe or a cone or plane tangent to some part of it, which can be further "unwrapped" into a two-dimensional plane (the map). A particular transformation of an area on the sphere to a plane will result either in distortion of the areal scale or of the shape. Different projections strive to minimize one or the other distortion. Conformal projections seek to preserve true shape: the best known of these is the Mercator (cylindrical) in which meridians are equi-spaced and parallels become closer as the equator is approached - a geometry that tends to enlarge the areas of land masses at high (nearer to the pole) latitudes. Equal-area projections, such as the Goode homolosine, typically have non-straight longitudes and may have unusual outlines. The polar projection, best for representing polar regions, is centered on the north or south pole around which is a series of concentric circles (latitudes) and straight radial lines (longitudes) outward to the outermost circle (the outline of the map). Depending on projection type, the scale applying to the map can be constant or will vary.
The third dimension - from which evidence of curvature and non-horizontal shapes is derived - is depicted by use of contour lines. A contour line connects all points of the same elevation within the mapped area. Imagine that you are standing at the base of a hill rising from a flat plane and ending upwards in a single crest point 100 meters (328 feet) higher. Now walk completely around the hill base keeping constantly at the same elevation. As you walk, you trace your path in some way (such as painting the line of your trail). If you could then transport yourself to a point high above the hill and look down, you would see this trace as a closed line outlining the shape of the hill's base. Now move up hillslope some fixed distance, say 20 m. (66 ft) higher than the base and again walk around the entire hill. Continue moving upslope at 20 meter (vertical or elevation) intervals; each time again walk horizontally around the hill. As you approach the crest, your walk is now of minimal length but still returns to the original starting point (is closed). When you again view this from high above, you will see the successive traces as a set of concentric closed lines, each interior one of lesser total length than the lower one outside. If labelled, each line has a value 20 meters higher than the next outside one; if the base is assigned a value of zero, then the upward sequence goes through 20, 40, 60, 80, .... up to the value of 100 m (the crest itself may be a few meters higher than 100, say at 105 m, and would be plotted as a point within the innermost contour). If the base chosen lies above sealevel, say at an elevation of 120 meters, then the sequence is 120...140...160...180...200...220 meters (with the crest point labelled as 225 m).
Code 935, Goddard Space Flight Center, NASA
Written by: Nicholas M. Short, Sr. email: nmshort@epix.net
and
Jon Robinson email: Jon.W.Robinson.1@gsfc.nasa.gov
Webmaster: Bill Dickinson Jr. email: rstwebmaster@gsti.com
Web Production: Christiane Robinson, Terri Ho and Nannette Fekete
Updated: 1999.03.15.