Welcome to this Home Page - a tutorial approach to learning about the role of space science and technology in monitoring the Earth's surface and atmosphere - sponsored by the Applied Information Science Branch(Code 935) at NASA's Goddard Space Flight Center. As you work through the 100 or so pages that will eventually constitute this Internet on-line Tutorial (or, its CD-ROM version), you will come to understand how remote sensing (a term defined at the beginning of the Introduction Section) is applied to studying the land, sea, and air making up the environments of our planet. Not only will you gain insight into past uses of aerial photography and space imagery as records of the Earth's geography as well as the future plans for more advanced monitoring systems, but you should actually develop skills in interpreting these visual displays and data sets both by direct inspection and by computer processing.
Remote sensing involves the use of instruments or sensors to "capture" the spectral and spatial relations of objects and materials observable at a distance - typically from above them. Normally, we experience our world from a more or less horizontal viewpoint while living on its surface. But, under these conditions our view is usually limited to areas of a few square miles at most owing to obstructions such as buildings, trees, and topography. The total area encompassed in our vistas is considerably enlarged if we peer downward from, say, a tall building or a mountain top. This increases even more - to perhaps hundreds of square miles - as we gaze outwards from an airliner cruising above 30000 feet. From a vertical or high oblique perspective, our impression of the surface below is notably different than when we scan our surroundings from a point on that surface. We then see the multitude of surface features as they would appear on a thematic map in their appropriate spatial and contextual relationships. This, in a nutshell, is why remote sensing is most often practiced from platforms such as airplanes and spacecraft with onboard sensors that survey and analyze these features over extended areas from above, unencumbered by the immediate proximity of the neighborhood. It is the practical, orderly, and cost-effective way of maintaining and updating information about the world around us.
It is safe to say - and emphasize - at this point of the Overview that remote sensing systems of various kinds are the most widely used tools for gathering information about the Earth, the planets, and the stars. In other words, remote sensing lies at the heart or core of efforts by NASA, the Russian space agency, and programs by other nations (mainly, Canada, France, Germany, Italy, India, China, Japan, and Brazil) to explore space from our terrestrial surface to the farthest reaches of distant galaxies.
Remote sensing began in the 1840s as balloonists took pictures of the ground using the newly invented photo- camera. Perhaps the most novel platform at the end of the last century is the famed pigeon fleet
that operated as a novelty in Europe. Aerial photography became a valuable reconnaissance tool during the First World War and came fully into its own during the Second WW. The logical entry of remote sensors into space began with the inclusion of automated photo-camera systems on the captured German V-2 rockets launched out of White Sands, NM. With the advent of Sputnik in 1957, the possibility of putting film cameras on orbiting spacecraft was realized. The first cosmonauts and astronauts carried cameras to document selected regions and targets of opportunity as they circumnavigated the globe. Sensors tuned to obtaining black and white TV-like images of the Earth were mounted on meteorological satellites that began to fly in the 1960s. Other sensors on those satellites could make soundings or measurements of atmospheric properties over a range of heights.
As an operational system for collecting information about the Earth on a repetitive schedule, remote sensing matured in the 1970s when instruments were flown on Skylab (and later, the Space Shuttle) and on Landsat, the first satellite dedicated specifically to monitoring land and ocean surfaces to map natural and cultural resources. A radar imaging system was the main sensor on Seasat and, going into the 1980s, a variety of specialized sensors - CZCS, HCMM, and AVHRR among others - were placed in orbit primarily as research or feasibility programs. The first non-military radar system was JPL's Shuttle Imaging Radar (SIR-A) on the Space Shuttle in 1982. Other nations soon followed with remote sensors that provided similar or distinctly different capabilities. By the 1980s, Landsat had been privatized and a widespread commercial utilization of remote sensing had taken root in the U.S., France, Russia, Japan and other nations. Much of this was, and is still being, driven by the growing awareness that the Earth's environments are in peril from man's activities and misuses.
To whet your appetite for more, we will now show you one of the typical early Landsat images that started the "bandwagon" of interest in use of satellites to monitor the Earth's surface. (You should also look more carefully at the image background for the logo title at the top of the Coverpage you accessed through Start: that scene shows an October 1972 Landsat 1 [it was called ERTS-1 at the time] panorama of California's Central Valley, the Coast Ranges, and the San Francisco and Monterey Bay areas.) The scene below is a Landsat 1 view of north-central Utah taken just 15 days after launch (August 7, 1972). The right side of the image is a bright red - the normal color for thick forests and grasslands as rendered in a false color image in which red is associated with healthy vegetation that is very bright in the near-infrared (see the Introduction Section for the explanation of color response and assignment). The red areas on the right coincide with the high Wasatch Mountains that run east of the
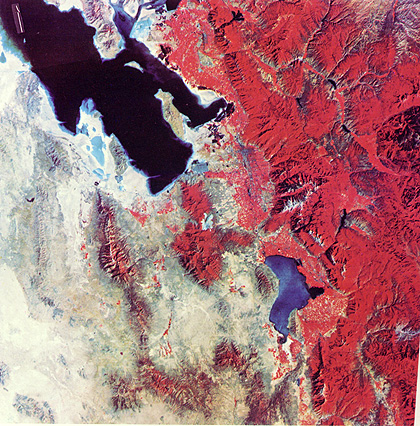
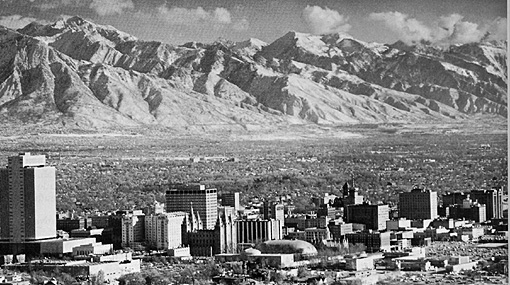
block-fault mountains and deserts (gray-tan tones) of western Utah. Other reds in small patches mark the farmlands of the desert plains whose potential inspired Brigham Young to settle his group in this "promised land". The Great Salt Lake occupies part of the upper scene (if you look carefully, you may see a slight tonal difference along a straight, sharp boundary; this is due to a cutoff of water circulation by the Union Pacific railroad causeway). Lake Utah (bluer because of silt) is to its south. The metropolitan area of Salt Lake City can be discerned in this image (we will challenge you to find it). This image, of course, is a vertical view. To acquaint you with looking at the Earth this way, we are adding a near-horizontal aerial view of the City and the Wasatch Front to its east - try to relate this oblique perspective with its appearance from Landsat.
This Tutorial will draw upon Landsat, SPOT and several radar systems to provide most of its examples of commonly used space imagery. Some other space systems designed for remote sensing use as land, ocean, and weather observers will be introduced and exemplified in various of the Tutorial Sections. We will list here the principal ones flown by the U.S. and other nations (identified in parenthesis) along with the date the first (and sometimes only) of each was launched.
Group 1 - Primarily Land Observers: Landsat (1-6) (1973); Seasat (1978); HCMM (1978); SPOT (France) (1-3) (1986); RESURS (Russia) (1985); IRS(1A-1D) (India) (1986); ERS (1- 2) (1991); JERS (1-2) (Japan) (1992); Radarsat (Canada) (1995); ADEOS (Japan) (1996) (Note 1: SIR- A (1981), (Note: SIR-A (1981), SIR-B (1984), and SIR-C (1994) are radar systems flown on Space Shuttles; a Laser Altimeter has also been flown on Shuttle)(Note also: many of the meteorological satellites produce lower resolution images of the land that have proved useful)
Group 2 - Primarily Meteorological Observers: TIROS (1-9) (1960); Nimbus (1-7) (1964); ESSA (1-9) (1966); ATS(g) (1-3) (1966); DMSP series I (1966); the Russian Kosmos (1968) and Meteor series (1969); ITOS series (1970); SMS(g) (1975); GOES(g) series (1975); NOAA (1-5) (1976); DMSP series 2 (1976); GMS series (Japan) 9 (1977); Meteosat(g) series (Europe) (1978); TIROS-N series (1978); Bhaskura (India) (1979); NOAA (6-14) (1982); Insat (1983); ERBS (1984); MOS (Japan) (1987); UARS (1991); TRMM (U.S./Japan) (1997)(Note 1: g = geostationary) (Note 2: Nimbus was also used for general land observations; e.g., Nimbus 6 carried SCMR, an experimental sensor designed to obtain information on surface composition)
Group 3 - Major Use in Oceanography: Seasat (1978); Nimbus 7 (1978) included the CZCS, the Coastal Zone Color Scanner that measures chlorophyll concentration in seawater; Topex-Poseidon (1992); SeaWiFS (1997)
(Note: NSCAT, the NASA Scatterometer, developed at JPL and launched in 1996 by a Japanese rocket, was designed mainly for oceanographic studies but has provided valuable information applicable to meteorology and land observations.)
This impressive list is convincing: Remote sensing has become a major technological and scientific tool used to monitor planetary surfaces and atmospheres. In fact, from a dollar-based measuring stick, the expenditures on observing Earth and other planets has since the earliest days of the space program now exceeded $150 billion. Much of this money has been directed towards practical applications, largely focused on environmental and natural resource management. The Table below, put together in 1981 by the writer, elaborates on this by summarizing principal uses in 6 disciplines.
All of these applications are still valid today, and many others have since been devised and tested, some of which will be introduced in various sections of this Tutorial. The literature on remote sensing theory, instrumentation, and applications is now vast - including a number of journals and reports of numerous conferences and meetings. The great improvements in computer-based image processing, especially now the ability of personal computers to handle large amounts of remote sensing data, have made satellite and manned platform observations accessible to universities, resources- responsible agencies, small environmental companies, and even individuals such as yourself. The concurrent development and rise of Geographic Information Systems (GIS) into widespread availability and use has provided an exceptional means for integrating timely remote sensing data with other spatial types of data. The GIS approach is well suited to storage, integration, and analysis, leading to information that has a practical value in many fields concerned with decision-making in resources management, environmental control, and site development.
The need to develop monitoring systems that can map changing land use, search for and protect natural resources, and track interactions among the biosphere, atmosphere, hydrosphere, and geosphere has become a paramount concern to managers, politicians, and the general citizenry in both developed and developing nations. This need has led to initialization of a mammoth international program to use a variety of technologies, centered on observation systems from space, to improve our ability to oversee and regulate the systems that govern the Earth's effective operations. Among names associated with this concept are the International Geosphere and Biosphere Program, the Global Change Program, Earth System Science, Mission to Planet Earth (MTPE), and the Earth Observing System (EOS). Lasting well into the first decade of the 21st Century, this program will witness the launch, starting in 1998, of several major platforms with a broad compliment of sensors supported by continuing operation of sensor systems already in place. The program will have far-reaching and at least indirect impact on all peoples of our planet as it addresses the many problems and concerns tied to the environment and to resources. When coupled and integrated with another major data management/decision making approach, known as Geographic Information Systems or GIS, MTPE and EOS should evolve into a highly efficient implement for continuous gathering and processing of the key elements of knowledge required to administer the complex interactions between natural surroundings and human endeavors.
The Internet is becoming a prime source for information on almost every aspect of remote sensing. Several sites offer good overviews of satellite remote sensing. One that has recently appeared, and provides an excellent synopsis of the main principles and applications, has been constructed by the Canadian Center for Remote Sensing (CCRS). Click here if you want to check it out now, or at your leisure.
If you would like a preview of how remote sensing is being applied to monitoring Man's influence on the environment, then glance over the Home Page recently added to the Internet by the Consortium for International Earth Science Information Network. Another online source of basic information about remote sensing is the author's (NMS) still relevant 1982 NASA Publication RP 1078: The LANDSAT TUTORIAL WORKBOOK. This, along with the author's MISSION TO PLANET EARTH: LANDSAT VIEWS THE WORLD (co-authored with Paul D. Lowman, Jr, Stanley C. Freden, and William C. Finch, Jr), THE HCMM ANTHOLOGY, NASA SP-465, and (co-authored with Robert Blair, Jr) GEOMORPHOLOGY FROM SPACE, NASA SP-486, are the prime sources of many of the illustrations and basic information used to prepare the Web Site. For those who wish to learn even more about the field, we invite you to look into the Home Page for the Remote Sensing Core Curriculum project which highlights a new educational approach now under development. Also, here is a list of sevenwell known textbooks that go into detail on most of the fundamentals and applications of Remote Sensing of the Earth:
The primary purpose of this Web Site Tutorial and its CD-ROM counterpar, then, is to inform both the professionals and the general public about the principles and the achievements of remote sensing, with emphasis on applications already demonstrated, and to point to the anticipated functions and benefits of the MTPE initiatives. As a secondary but nevertheless important goal, the Tutorial is intended to be a learning resource for college students as well as individuals who require some indoctrination in the basics of space-centered remote sensing in support of various organizations, such as the Regional Validation Centers (see Code 935 Home Page, accessible on the Coverpage), that will include associates who assist in providing input information into day-to-day operations. Thirdly, we hope that this survey of Satellite Remote Sensing will attract and inspire a few individuals from the world community who might someday consider a career in this field or in the broader fields allied with Earth System Science (ESS) and the Environment. For those who wish to learn even more about those fields before they are covered in Section 16, we invite you to look now into a Home Page sponsored by the Universities Science Research Association (USRA) which highlights a new educational approach based on ESS.
Here is how we hope to accomplish these objectives by exposing you to a comprehensive survey of remote sensing and its many ramifications. Look first at this general Table of Contents:
Foreword
Overview of this Remote Sensing Tutorial
Introduction to Remote Sensing: Historical and Technical Perspectives
Section:
1. Image Processing and Interpretation: Morro Bay, California
2. Geologic Applications: Stratigraphy; Structure; Landforms
3. Vegetation Applications: Agriculture; Forestry; Ecology
4. Urban and Land Use Applications
5. Mineral and Oil Resource Exploration:
6. Flight Across the United States: Boston to San Francisco
7. Regional Studies: Use of Mosaics from Landsat
8. Radar and Microwave Remote Sensing
9. The Warm Earth: Thermal Remote Sensing
10. Aerial Photography as Primary and Ancillary Data Sources
11. The Earth's Surface in 3-D: Stereo Systems and Topographic Mapping
12. The Human Remote Senser in Space: Astronaut Photography
13. Collecting Data at the Surface: Ground Truth; Hyperspectral Remote Sensing
14. The Water Planet: Meteorological, Oceanographic and Hydrologic Remote Sensing
15. Geographic Information Systems: The GIS Approach to Decision Making
16. Earth Systems Science; Mission to Planet Earth and the EOS Program
17. Use of Remote Sensing in Basic Science Studies I: Mega-Geomorphology
18. Basic Science Studies II: Impact Cratering
19. Planetary Remote Sensing: The Exploration of Extraterrestrial Bodies; Cosmology
20. Remote Sensing into the 21st Century; The Commercialization of this Technology
Glossary
Appendix 1: Interactive Image Processin
Unlike a formal course in the subject, with chapters covering principles, techniques and applications introduced in a pedagogic and systematic way, we intend to instruct simply by leading you through a series of sections each focused on one or more relevant topics. Because most remote sensing data can be presented as visuals, we will build our treatment around illustrations as space images, classifications, maps, and plots rather than numerical data sets, although these latter are the real knowledge base for applications scientists in putting this information to practical use. (Some of this material has been acquired by direct downloading off the Internet; we are grateful to the source organizations and individuals whom we may not acknowledge if it interrupts the flow of the text.) These illustrations will be accompanied by descriptions and discussions to aid in interpreting the concepts the visuals represent. "Standard" space images, particularly those from Landsat sensors, are usually the focal points of a section but special computer-based processing renditions are frequently added along with ground photos that depict features in a scene and descriptive maps where appropriate.
Most of the images will be downloaded automatically as each page comes up. Depending on your browser, computer power, and Internet transfer rates, you should be able to manipulate the images in special ways - such as through enlargements to bring out details. In some instances, you may wish to print out an image for reference rather than scrolling to find it on screen if you have moved on to a different page. NOTE: The image layout was designed on the principal writer's 21-inch monitor so that many images in the original version were placed side by side and are referred to in the text as Left and Right. On smaller monitors many such images are going to display Top and Bottom: since these are still the most common screen sizes in use, during a later revision we have tended towards deliberately re-positioning those images in this fashion and refer to that T-B arrangement in the text (but simply be aware that on your particular monitor, its browser display may conflict with the L-R or T-B locator information).
We will also embed numerous links to other sources of information on remote sensing and to various continuing or planned programs. Some of these consist of federal or international programs such as MTPE whereas others are ties to educational or commercial organizations that provide training and services. These in turn have their own sets of links which, as you explore them, will broaden your acquaintance with the many facets of remote sensing and its popular applications.
A couple of caveats: This Tutorial is image- and graphics-intensive. Unless you are on a T-line, cable, ISDN or some other broadband carrier, you may have to wait 5+ minutes to download the larger images found on many pages. You may wish to turn off or defer these images to receive text only. In some instances, we have provided automatic enlargements of certain images - those surrounded by a blue border - by clicking within. The images themselves may vary in quality - both in tone or color balance and resolution - depending on your monitor/graphics card combination and other factors. Thus, what is described in the text may not be easily grasped from the screen renditions. Whenever feasible, we have wrapped descriptive text around smaller images to facilitate comparing textual pointers with the illustration. For certain graphics, such as locator maps, you might wish to print a copy to keep next to you rather then jumping back and forth within a page or to different pages when text references graphics out of direct view.
The Tutorial begins with an Introduction which covers the principles of physics (especially electromagnetic radiation) underlying remote sensing, then considers the main kinds of observing platforms in use, and closes with a recounting of the history of satellite systems with accent on Landsat, presenting in some detail the particulars of its two prime sensors. Many of the subsequent sections/topics will center on Landsat as this continues to be a kingpin among the several remote sensing systems currently operating. Although they constitute by far the largest number of Earth-observing platforms, satellites concerned with meteorological and oceanographic/hydrologic phenomena will be considered primarily in Section 14, but in some instances scenes taken by metsat sensors over land where surface or environmental features are strongly expressed will be included in other sections. The first section (1) is one of the longest in this Web series because it seeks to introduce most of the major concepts behind image analysis and interpretation by "walking" you through the product types and processing output in common use. Perusal through the Introduction and Sections 1, 8 and 9 is the minimum effort we suggest investing if you want some idea of "what all the fuss is about".
We especially call your attention to Section 19 - Planetary Remote Sensing. While this topic seemingly strays from the main theme of the Tutorial - Remote Sensing of the Earth -, it offers a comprehensive summary of the main achievements in the exploration of our Solar System. This centerpiece of the U.S. and Russian space programs relies heavily on remote sensing techniques. The review in Section 19 of these accomplishments affords an in-depth examination of what we have learned about these fascinating other worlds - planets, satellites, asteroids - along with an embedded survey (as a link selected optionally) that considers some basic ideas underlying astronomy and cosmology. But, beware: the section is quite long and has more than 140 graphics (mostly images), some online, others accessible by linking.
A final note: In keeping both with scientific convention and the intended worldwide use of this Tutorial, we will normally specify measurments in metric system units, especially where electromagnetic spectrum and other units in physics are involved, but will place English unit equivalents in parentheses where appropriate or to clarify, particularly when dealing with geographic parameters.
We close this overview with a presumption that perhaps you may wish to be apprised of the background of the two principal architects of this Home Page. If not, move on to the Table of Contents which categorize those sections now ready for inspection. Also, we wish to acknowledge the excellent assistance by Robert Rush of Bloomsburg, PA in restructuring many of these Web pages for the Internet.
Nicholas (Nick) M. Short: Dr. Short, a native of St. Louis, MO, is a geologist who received degrees in that field from St. Louis University (B.S.), Washington University (M.A.), and the Massachusetts Institute of Technology (Ph.D); he also spent a year in graduate studies in the geosciences at The Pennsylvania State University. In his early post-graduate career, he worked for Gulf Research & Development Co., the Lawrence Livermore Laboratory, and the University of Houston. During the 1960s he specialized in the effects of underground nuclear explosions and asteroidal impacts on rocks (shock metamorphism), and was one of the original Principal Investigators of the Apollo 11 and 12 moon rocks. He joined NASA's Goddard Space Flight Center in 1969 as one of the first discipline specialists supporting the Landsat program. Over the next 19 years, he authored the Landsat Tutorial Workbook and The HCMM Anthology and co- authored Mission to Earth: Landsat Views the World and Geomorphology from Space, along with publications dealing mainly with geological remote sensing. After retiring from NASA in 1988, Dr. Short taught remote sensing at Bloomsburg University in Pennsylvania until 1992.
Jon W. Robinson: Dr. Robinson received his B.S. in Zoology from the University of Michigan, Ann Arbor, He received his MA and Ph.D. in Systematics & Ecology from the University of Kansas, Lawrence. After completing his Ph.D. he worked at the Center for Research. Inc. at the University of Kansas with some of the first Landsat data. He then worked as a Biometrician at the Museum of Natural History, Smithsonian Institution. Since 1976, he has worked for a number of contractors at NASA/Goddard Space Flight Center. He currently works for Hughes STX Corporation. Over the years, he has worked with data from a variety of platforms and sensors including Heat Capacity Mapping Mission (HCMM), GOES, Landsat, ASAS and AVHRR. Dr. Robinson worked in the Eastern Regional Remote Sensing and Applications program at Goddard Space Flight Center during the late 1970's. This program was designed to help transfer remote sensing technology to state and local governments, and the private sector. He was one member of a two person team, training members of the Chinese Academy of Sciences in remote sensing when his employer installed the first Landsat ground station in China.
PostScript: The idea behind this Tutorial is the outgrowth of a suggestion to produce it made by Nicholas M. Short, Jr., who at the time was a computer scientist at Goddard's Code 935 (the sponsor), conceived by him in part as an alternative source of information on remote sensing to that embodied in NMS, Sr's Landsat Tutorial Workbook (now out-of-print) for which requests continued over the years to funnel through NMS, Jr. as a consequence of name recognition (and confusion).
Those of us involved in this Tutorial project welcome any comments or content corrections you may wish to pass on to us.
We are constantly revising the materials and continually try to find errors and mis-statements but your help as a reader is
much appreciated. You can send your observations directly to: nmshort@epix.net
As most users of the Internet readily know, URLs are often changed (different addresses), while some are even dropped and removed. Be advised that we have striven to make these as current as possible but as time progresses some will disappear or otherwise be altered without our knowledge. Bring any problems of this kind to our attention via e-mail.
In mid-January, 1998, the first versions of the Tutorial were placed in CD-ROM format and about 160 beta versions were distributed to the user community during an ASPRS Conference in late 1997 to solicit critiques and suggestions for improvement. In September, 1998, the Earth Science Enterprise Office at NASA's Goddard Space Flight Center issued the result of the NASA Education Office review of the Remote Sensing Tutorial. It was given the rating of "Recommended - Broad Distribution". The upshot of this is that distribution of the Tutorial will be extended to that organization. As of, February 1, 1999, the most current version of the CD will be avilable through NASA's Central Operation of Resources for Educators (CORE) - click here for instructions on how to get the CD.
If you are working exclusively from the CD-ROM version, then we suggest you periodically check the Internet version for possible updates to Sections and pages that will be added from time to time as new material develops (especially after data from a new mission are released). While, of course, this information cannot be transferred to the CD-ROM (unwritable), you can at least be aware through the Net of these changes. The Internet URL is on the back of the CD- ROM plastic holder or you can access it as:
The big news as of December 1, 1998 is that an Appendix (1) has been added that will allow users to learn and use an interactive image processing program, called PIT. After working through this appendix, you will have the opportunity to actually process several types of space imagery using this computer- based software, which will be included on the CD-ROM as well as through FTP download across the internet. Its principal feature is a group of programs that allow one to classify the scene features into a "map" format.
Code 935, Goddard Space Flight Center, NASA
Written by: Nicholas M. Short, Sr. email: nmshort@epix.net
and
Jon Robinson email: Jon.W.Robinson.1@gsfc.nasa.gov
Webmaster: Bill Dickinson Jr. email: rstwebmaster@gsti.com
Web Production: Christiane Robinson, Terri Ho and Nannette Fekete
Updated: 1999.03.15.