| Band No. | Wavelength Interval (µm) |
Spectral Response |
Resolution (m) |
| 1 | 0.45 - 0.52 | Blue-Green | 30 |
| 2 | 0.52 - 0.60 | Green | 30 |
| 3 | 0.63 - 0.69 | Red | 30 |
| 4 | 0.76 - 0.90 | Near IR | 30 |
| 5 | 1.55 - 1.75 | Mid-IR | 30 |
| 6 | 10.40 - 12.50 | Thermal IR | 120 |
| 7 | 2.08 - 2.35 | Mid-IR | 30 |
The six reflectance bands obtain their effective resolution at a nominal orbital altitude of 705 km (437 miles) through an IFOV of 0.043 mrad; the IFOV for the thermal channel is 0.172 mrad.
Band 1 is superior to MSS 4 in detecting some features in water; it also allows quasi- natural color composites to be put together. Band 5 is sensitive to variations in water content, both in leafy vegetation and as soil moisture; it also distinguishes between clouds (appearing dark) and bright snow (light). This band also responds to variations in ferric iron (Fe2 O3) content in rocks and soils, with materials containing this substance showing higher reflectances as its percentage increases. Band 7 likewise reacts to moisture contents and is especially suited to detecting hydrous minerals (such as clays or certain alteration products) in geologic settings. Band 6 can distinguish a radiant temperature difference of ~ 0.6 degrees C and is helpful in discriminating rock types whose thermal properties permit varying extents of heating and consequent differences in near surface temperatures; it often can pick out changes in ground temperatures due to moisture variation and can single out vegetation due to its evaporative cooling effect. The higher resolution achieved in the reflective bands is a significant aid in picking out features and classes whose minimum dimension is usually on the order of 30 m (100 ft) . Thus, houses and smaller buildings, which were unresolvable in MSS images, can often be discerned.
The size and shape of TM images from Landsats 4 and 5 are identical to the MSS images. At first glance, the quality and characteristics of the full scene TM images from 4 and 5 seem similar to those made by the MSS after optimal computer-based processing but on closer inspection they do appear sharper. This apparent similarity is due to the need to resample the TM images for TV monitor displays (which are not high resolution systems capable of reproducing all TM pixels) by dropping some pixels. The influence of the better TM resolution (when un-resampled) becomes apparent whenever photographs of full scenes are enlarged (pictures more than a meter on a side can be produced with exceptional clarity) or subscenes are extracted and enlarged.
Below are three examples of TM imagery. These are all in color. We will refrain here from displaying any of the individual black and white TM bands as excellent examples of these are presented and examined in detail in Section 1, which is a comprehensive example of one TM subscene, that of Morro Bay, California.
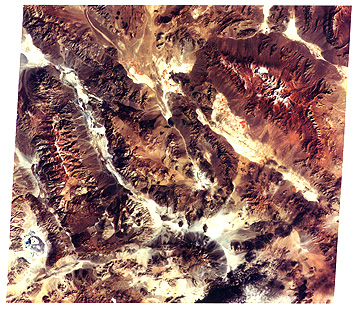
The first TM image is a late Fall false color (TM bands 2, 3, 5 in blue, green, red) rendition of mountain ranges in southeastern California into Nevada. The large valley towards the left is Death Valley, with the Panamint Range to its left. The large range near the upper right is the Spring Mountains, whose reddish tones indicate vegation (mixed evergreens-deciduous trees). The bottom of the image includes the north edge of the Mojave Desert.
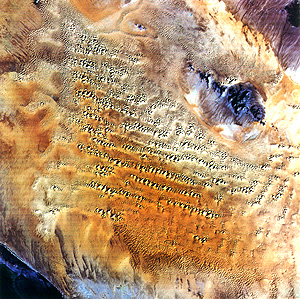
The second scene is an 80 km (120 mile) enlargement of a part of a TM image covering the Sonoran Desert of northwest Mexico (a bit of the Gulf of California appears in the lower left), shown here in true color. This subscene is dominated by star and crescentic sand dunes in this vast sand sea deposited over igneous lavas. The dark patches in the upper right are volcanic lavas but the dark mass to its southwest is the Sierra del Rosario, composed of granitic rocks.
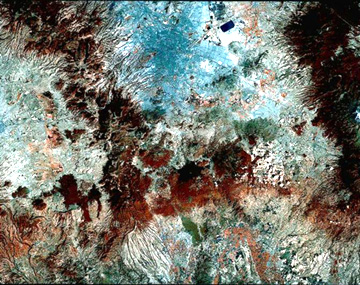
The third TM image is also a subscene, about 70 km (43 miles) on a side, in west-central Mexico. Mexico City, with the largest urban population in the western hemisphere (about 30 million), appears in this false color version as the medium blue area in the upper left part of the image; note that its area is much less than that of Los Angeles (one of the opening scenes in Section 4), indicating a high density of the populace, i.e., crowding. The city lies at an average elevation of 2800 meters (9100 feet) astride the Neo-Volcanic Plateau, a zone that runs across Mexico and is seismically active. Just off the image to the right is a cluster of active volcanoes including the famed Popocatepetl (over 5100 meters [almost 17000 feet]).
All the Landsats follow a near-polar orbit (inclined ~ 9 degrees to west of longitudinal lines; passing within 8 degrees of the poles) and are sun-synchronous (satellite precesses about Earth at same angular rate as Earth rotates; thus, in descending mode [N to S] it crosses the equator each time between 9:30 and 10:00 A.M. local time). Landsats 1-3 make 14 full orbits (each successive one displaced 2875 km [ 1785 miles] to the west) each day (3 over U.S.) and after 252 orbits repeat their previous ground tracks every 18 days; Landsats 4-5, from lower altitude (705 km [437 miles]), after 233 orbits cover the same area again every 16 days. To fully image the entire Earth's land surface (except for polar regions), ~11000 scenes are required.
For those interested in the history of the Landsat program, click on this 11 page summary. This Chronology was prepared for NASA at its Ames Research Center. They also maintain a general information bulletin board on Landsat (which includes the above historical perspective) that can be accessed on http://geo.arc.nasa.gov/sge/landsat/landsat.html.
Code 935, Goddard Space Flight Center, NASA
Written by: Nicholas M. Short, Sr. email: nmshort@epix.net
and
Jon Robinson email: Jon.W.Robinson.1@gsfc.nasa.gov
Webmaster: Bill Dickinson Jr. email: rstwebmaster@gsti.com
Web Production: Christiane Robinson, Terri Ho and Nannette Fekete
Updated: 1999.03.15.